Get at least 12 observations before making a confidence interval?
 Subscribe to Decision Science News by Email (one email per week, easy unsubscribe)
GET CONFIDENT ABOUT YOUR INTERVALS
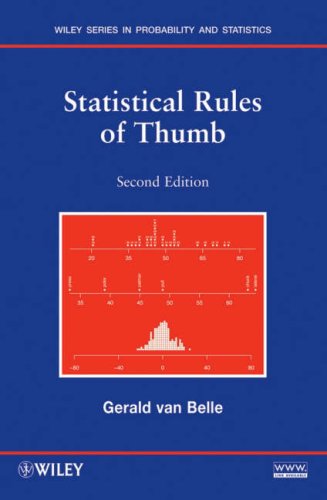
Decision Science News is happy with its purchase of Statistical Rules of Thumb by Gerald van Belle many years ago. It’s full of examples in which math can surprise.
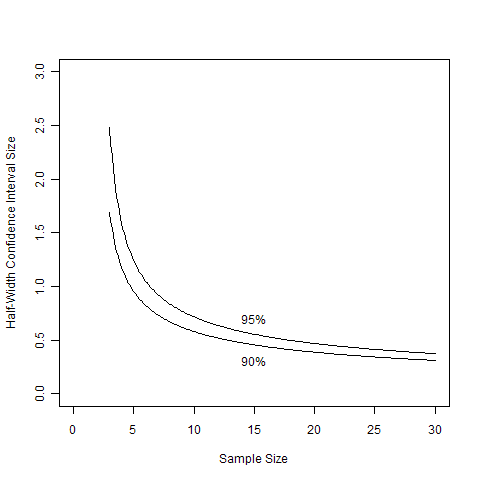
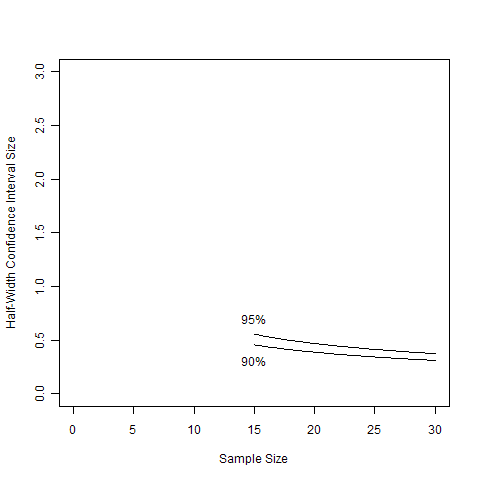
The first example in the book is titled “use at least 12 observations in constructing a confidence interval”. When people first hear this they think, nonsense, there’s nothing magic about the number twelve. And then they think that confidence interval sizes have to do with the square root of the sample size, but that still doesn’t do it. Thinking harder, one realizes that the half-width confidence interval for a sample of size n is t(n-1,1-alpha)/sqrt(n). One plots this out for 90% and 95% CIs and one sees that the first intuition was right, there is nothing magic about 12, but the plot above sure does seem to stop dropping in width somewhere around there. Maybe 15 is a safer number. To make it easier to see, here are the points on the above graph from the value 15 and greater.
We love heuristics for statistics, but do not promote following rules of thumb without reflection. We do promote playing with such rules of thumb as a way to become aware of the tradeoffs one makes in designing experiments. To encourage such play, we post the R code behind the above graphs here.
R CODE
(Don’t know R yet? Learn by watching: R Video Tutorial 1, R Video Tutorial 2)
n=seq(3,30,.1)
alpha=.1
y90=qt(1-alpha/2,n-1)/sqrt(n)
alpha=.05
y95=qt(1-alpha/2,n-1)/sqrt(n)
plot.new()
plot(n,y90,type=”l”,xlim=c(0,30),ylim=c(0,3),ylab=”Half-Width Confidence Interval Size”, xlab=”Sample Size”)
lines(n,y95,type=”l”)
text(15,y95[which(n==15)]+.15,labels=”95%”)
text(15,y90[which(n==15)]-.15,labels=”90%”)
#second plot
plot.new()
a=min(which(n>=15))
b=max(which(n>=15))
plot(n[a:b],y90[a:b],type=”l”,xlim=c(0,30),ylim=c(0,3),ylab=”Half-Width Confidence Interval Size”, xlab=”Sample Size”)
lines(n[a:b],y95[a:b],type=”l”)
text(15,y95[which(n==15)]+.15,labels=”95%”)
text(15,y90[which(n==15)]-.15,labels=”90%”)
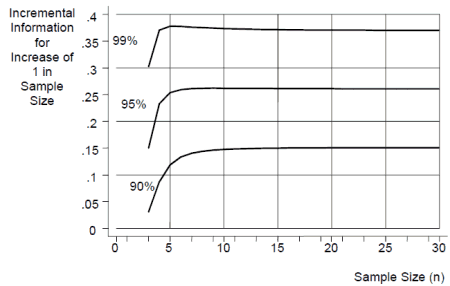
Update: After Arjan’s comment, I tried to figure out if Van Belle is Dutch. I didn’t figure that out, but I did learn that he keeps a lot of these tips on his site. There’s even one on the 12 observation rule and some information added by others, including this figure:


Dutch people rule.
April 15, 2010 @ 7:53 am
Arjan,
Dutch people ruled — Indonesia and other places. Today they are a peaceful people who enjoy the occasional rijsttafel. You should get to know them.
April 15, 2010 @ 10:39 pm
You will find out in end of 2010 that dutch will rule the science world. There is no doubt dutch people have great skills, which i find out in drill.
I am now bookmarking in mine favorite domains section.
Thanks
April 18, 2010 @ 7:30 am