Maps without map packages
LATITUDE + LONGITUDE + OVERPLOTTING FIX = MAPS
Decision Science News is always learning stuff from colleague, physicist, mathlete, and all-around computer whiz Jake Hofman.
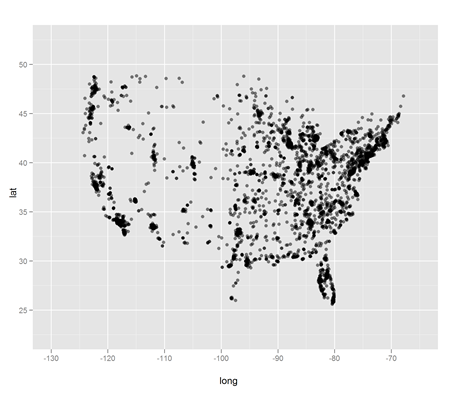
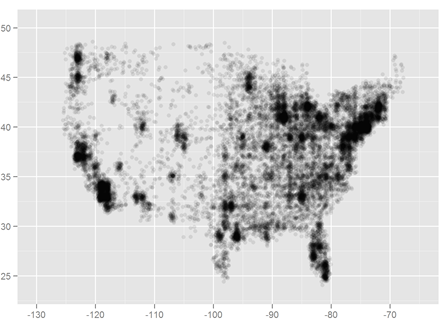
Today, it was a quick and clean way to make nice maps in R without using any map packages: just plot the latitude and longitude of your data points (e.g. web site visitors) along with the “alpha” parameter to allow for layering of coincident points. It’s duh in hindsight.
Above we see a how it looks with a little data. Below is the result with more data and a lower alpha:
In the words of James Taylor, all you have to do is call:
library(ggplot2)
qplot(long,lat,data=us,alpha=I(.1))
To get the Decision-Science-News-approved framing and aspect ratio for the USA:
qplot(long,lat,data=wtd,alpha=I(.1),
xlim=c(-125-10/2,-65),ylim=c(23.5,50.5)) +
opts(aspect.ratio = 3.5/5)
As we are certain that there are readers who will want to show that there are much nicer ways to do this, we say: download the data and show us.


Here’s the equivalent in Mathematica, though I haven’t figured out the equivalent of that nifty alpha parameter yet:
http://stackoverflow.com/questions/3162286/scatter-plot-with-indication-of-the-density-of-points
July 2, 2010 @ 12:17 am
I quite like a “hexbin” plot for handlng the overplotting problem:
library(ggplot2)

a = read.csv('latlong.csv')
#lo-res bins
ggplot()+
layer(
geom = 'hex'
, stat = 'bin'
, stat_params = list(
bins = 30
)
, data = a[a$long>-130,]
, mapping = aes(
y = lat
, x = long
)
)+
opts(aspect.ratio = 3.5/5)
#hi-res bins
ggplot()+
layer(
geom = 'hex'
, stat = 'bin'
, stat_params = list(
bins = 100
)
, data = a[a$long>-130,]
, mapping = aes(
y = lat
, x = long
)
)+
opts(aspect.ratio = 3.5/5)
July 2, 2010 @ 1:14 am
Oops, seems I pasted broken code earlier (the “stat=’bin'” line was unnecessary and in fact detrimental). Here’s the proper code (with a bit better formatting this time):
library(ggplot2)

a = read.csv('latlong.csv')
#lo-res bins#
ggplot()+
layer(
geom = 'hex'
, stat_params = list(
bins = 30
)
, data = a[a$long>-130,]
, mapping = aes(
y = lat
, x = long
)
)+
opts(aspect.ratio = 3.5/5)
#hi-res bins#
ggplot()+
layer(
geom = 'hex'
, stat_params = list(
bins = 100
)
, data = a[a$long>-130,]
, mapping = aes(
y = lat
, x = long
)
)+
opts(aspect.ratio = 3.5/5)
July 2, 2010 @ 1:44 am
Hei
I have data in a matrix with longitude (x coordinates) regularly spaced at 2.8 degrees and lat (y coordinates) at 2.5 degrees. x<-seq(29,36,2.8) & y<-seq(-4,6,2.5)
My matrix is 26 rows *28 e.g. z<-matrix(runif(26*28),26,28). I want to Resample this matrix to a different resolution of 0.5 * 0.5 in R without using interpolation (e.g inter in Akima package) because this distorts the data i.e. The data should not vary smoothly in space. What I want is analogous to resample in a GIS withoout smoothing, something like assigning the new pixel with the average or maximum of the contents in the pixel location.
July 2, 2010 @ 12:13 pm
sorry about the 26 x 28 rows. That is roughly the size of the new resampled matrix
can anyone help me please
July 2, 2010 @ 12:18 pm
A more deatiled explanation of my problem
x<-seq(29,36,2.8)#lon
y<-seq(-4,6,2.5)#lat
z<-matrix(runif(length(x)*length(y)),length(x),length(y))# my original matrix
par(mfrow=c(2,2))
image(x,y,z,col=cm.colors(20))# plots the data as is
#Using Interpolation with Akima Interp
library(akima)
xd<-seq(29,36,1)# new lon
yd<-seq(-4,6,1) # new lat
old.kords<-expand.grid(x,y)
zd<-interp(old.kords[,1],old.kords[,2],c(z),xd,yd)
image(xd,yd,zd$z,col=cm.colors(20))# shows that interpolation has distorted the spatial pattern. What i want is similar pattern but with finer grid. Interp clearly cannot do this.
# so how do i resample without changing the pattern.
July 2, 2010 @ 12:42 pm
Addendum: Here’s the Mathematica equivalent:
data = Rest@Import["http://www.decisionsciencenews.com/wp-content/uploads/2010/07/latlong.zip", "latlong.csv"];
ListPlot[data, PlotRange -> {{-130, -65}, {23.5, 50.5}}, Frame -> True, PlotStyle -> Opacity[0.5]]
That’s two lines, including downloading, unzipping, and parsing the data. And no libraries! Take that, R!
July 2, 2010 @ 1:59 pm
Jjunju, you should post your question on stackoverflow.com … you’ll get an answer in no time at all. See comment #1 for the URL. You’ll want to post it using the “R” tag, of course.
July 2, 2010 @ 4:40 pm
@Daniel Reeves ( “That’s two lines, including downloading, unzipping, and parsing the data. And no libraries! Take that, R!” )
R can be similarly terse/opaque if you want to code that way. Granted, I think you need ggplot2 to implement opacity (I could be wrong), but I’d say that a single (free) external package install isn’t all that daunting. Otherwise, have fun with your $140-$2500 and closed-source Mathmatica!
July 2, 2010 @ 5:47 pm
This exercise is nearly useless, especially for large areas (e.g. the entire US). The reason for using mapping packages is to correct for geographic projections. Just because it’s easy doesn’t make it useful or correct.
July 6, 2010 @ 10:01 pm
>Just because it’s easy doesn’t make it useful or correct.
But it does make it awesome!
July 7, 2010 @ 4:43 am
[…] (“birds of a feather shop together“) and cool, lightweight visualizations (“maps without map packages in R“). Today, both topics come together in this wonderful discovery of Eric Fischer’s […]
September 22, 2010 @ 8:07 pm
Hi to all,
I’m trying to make a map with JunJius code but I have a problem when reading my data and building the matrix.
x<-seq(-83.2,-68.1, 0.1)#lon
y<-seq(-58.6, -4.1, 0.1)#lat
My z values are obtained by reading an ASCII file and when introducing them to build the matrix I get "Numeric,546". If I read the data I can see the data set but when building the matrix I'm finding it impossible. I have tried the as.matrix, as.numeric and other functions but…
Any suggestions?
Thanks in advance
November 30, 2010 @ 4:15 pm