R video tutorial number 2
READ TEXT FILES, RUN MODELS
The Decision Science News R video tutorials continue with number 2. (If you missed that last one, you will want to watch R Video Tutorial Number 1 first.) The Goldstein pedometer dataset can be downloaded from http://www.dangoldstein.com/flash/Rtutorial2/pedometer.csv
High Res Version: http://www.dangoldstein.com/flash/Rtutorial2/Rtutorial2.html
Topics covered this week include:
- Tricking R into starting in your working directory
- Reading in text files
- Accessing columns in data frames
- Creating histograms
- Side effects and optional parameters of function calls
- Fitting simple linear models
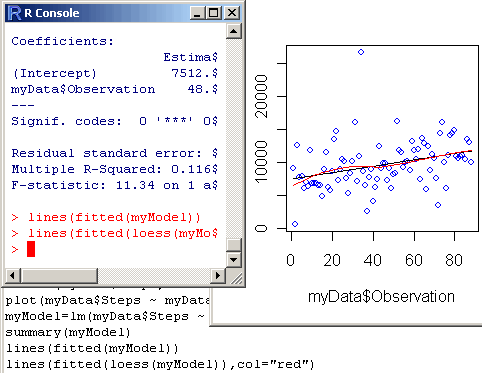
- Adding least-squares and loess lines to plots
The commands in the tutorial are:
myData=read.table("pedometer.csv", header=TRUE, sep=",")

x=hist(myData$Steps,col="lightblue")

x=hist(myData$Steps,breaks=20,col="lightblue")

plot(myData$Steps ~ myData$Observation,col="blue")

myModel=lm(myData$Steps ~ myData$Observation)

summary(myModel)

lines(fitted(myModel))

lines(fitted(loess(myModel)),col="red")
Can’t view flash? Download movie If you see no image under Windows, download the TSSC Codec.


