Misleading comparisons of probability
THE SAME EVENT DESCRIBED IN DIFFERENT-SOUNDING WAYS
We’ve written before about avoiding relative risk formats in communicating risks to the general public.
One issue is that subtle changes in terminology lead to vastly different figures. For example, imagine there are two coaches, A and B. When Coach A is working, the team catches the ball 16 times per 100. When Coach B is working, the team catches the ball 8 times per 100. Those are the facts. Now lets look at the range of numbers we can generate with relative risks from those facts.
- Going from Coach B to Coach A, the relative chance of catching the ball increases 100%. Let’s publish it in Science!
- Going from Coach A to Coach B, the relative chance of catching the ball drops 50%. Somebody call the newspaper!
- Going from Coach A to Coach B, the relative chance of dropping the ball increases 9.5%. Yawn
- Going from Coach B to Coach A, the relative chance of dropping the ball decreases 8.7%. Zzz….
After reading, many people will forget details such as whether the statistic was going from A to B or B to A, whether it concerned catching or dropping, or what the sign was, leaving different people with different vague ideas that something in the set of -100%, -50%, -9.5%, -8.7%, 8.7%, 9.5%, 50%, 100% had something to do with coach quality.
We see here that relative risk formats can make a catch rate change from 16% to 8% look like a very different animal than a drop rate change from 84% to 92%. But they are not different animals, they are two ways of referring to the exact same event.
Don’t believe me? Without looking up, try to remember the relative change in drop rate going from Coach A to Coach B.
So. Is the best practice just to give two numbers, that is, tell the readers the catch rate went from 16% to 8%? Or to tell them that the drop rate went from 84% to 92%?
The problem is, even when avoiding relative risk formats, changes between small numbers just look bigger than changes between big numbers, even when the small numbers and the big numbers express the exact same event. That is, 8 vs 16 looks like a bigger deal than 92 vs 84.
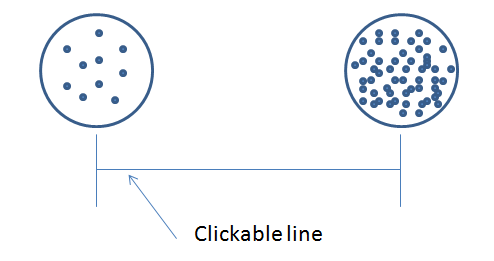
Here’s an experimental demonstration. Stanislas Dehaene and colleagues surveyed Mundurucu participants (in the Amazon) and Western participants (in the USA) on where they felt numbers lie on a scale from from 10-100. Specifically, participants had an interface like that pictured above, with 10 dots on the left and 100 dots on the right. They were then shown between 10 and 100 dots and asked to click on the line where they would fall.

Data on the left are from the Mundurucu participants, those on the right from American participants.
Both the Amazonians and the US participants had negatively accelerated response curves. For instance, when shown 30 dots, the Mundurucu clicked the middle of the scale, and the Americans placed 40 dots in the middle of the scale. With such curves, differences between small numbers take up more space on the scale than equal differences between large numbers, which is why a rate change of 16 to 8 sounds like a bigger deal than a rate change of 84 to 92. This is another instance in which people seem attuned to relative differences over and above absolute differences: the Weber-Fechner idea.
When expressing changes in probabilities, it makes us nervous that people can play games. They can choose between small numbers (here catch rates) and large numbers (drop rates) to play up or play down a point. This post discusses how this can happen whether one uses relative risk calculations or simply provides before and after numbers. This is one reason we are fans of providing absolute changes in probability. Going from Coach A to Coach B, catches decreased 8 percentage points, which is to say drops increased by 8 percentage points. With this formulation, no matter how the thing is expressed, the only thing the forgetful can get wrong is the sign.
REFERENCES
Dehaene, Izard, Spelke, Pica. (2008). Log or Linear? Distinct Intuitions of the Number Scale in Western and Amazonian Indigene Cultures. Science, 320, pp 1217-1220.
Addition Is Useless, Multiplication Is King: Channeling Our Inner Logarithm
R CODE
options(digits=2)

CoachAcatch=16 # Coach 1 catch rate

CoachAdrop=100-CoachAcatch # Coach 1 drop rate

CoachBcatch=8 # Coach 2 catch rate

CoachBdrop=100-CoachBcatch # Coach 2 drop rate

#Going from Coach A to Coach B

sprintf("Relative risk of catching the ball: %.1f%%",(CoachBcatch-CoachAcatch)/CoachAcatch*100)

sprintf("Relative risk of dropping the ball: %.1f%%",(CoachBdrop-CoachAdrop)/CoachAdrop*100)

#Going from Coach B to Coach A

sprintf("Relative risk of catching the ball: %.1f%%",(CoachAcatch-CoachBcatch)/CoachBcatch*100)

sprintf("Relative risk of dropping the ball: %.1f%%",(CoachAdrop-CoachBdrop)/CoachBdrop*100)

#Going from Coach A to Coach B

sprintf("Absolute risk of catching the ball: %.1f%%",(CoachBcatch-CoachAcatch))

sprintf("Absolute risk of dropping the ball: %.1f%%",(CoachBdrop-CoachAdrop))

#Going from Coach B to Coach A

sprintf("Absolute risk of catching the ball: %.1f%%",(CoachAcatch-CoachBcatch))

sprintf("Absolute risk of dropping the ball: %.1f%%",(CoachAdrop-CoachBdrop))


[…] Misleading comparisons of probability […]
December 18, 2011 @ 4:49 pm