How many calories should you eat per day?
US GOVERNMENT GUIDELINES BY AGE, SEX, ACTIVITY LEVEL
At Decision Science News, we are always on the lookout for rules of thumb.
Our colleague Justin Rao was thinking it would be useful to express calories as a percentage of daily calories. So instead of a coke being 150 calories, you could think of it as 7.5% of your daily calories. Or whatever. The whatever is key.
This is an example of putting unfamiliar numbers in perspective.
So, we were then interested to see if there would be an easy rule of thumb for people to calculate how many calories per day they should be eating, so that they could re-express foods as a percentage of that.
We found some calorie guidelines on the Web published by the US government. With the help of Jake Hofman, we used Hadley Wickham‘s rvest package to scrape them and his other tools to process and plot them.
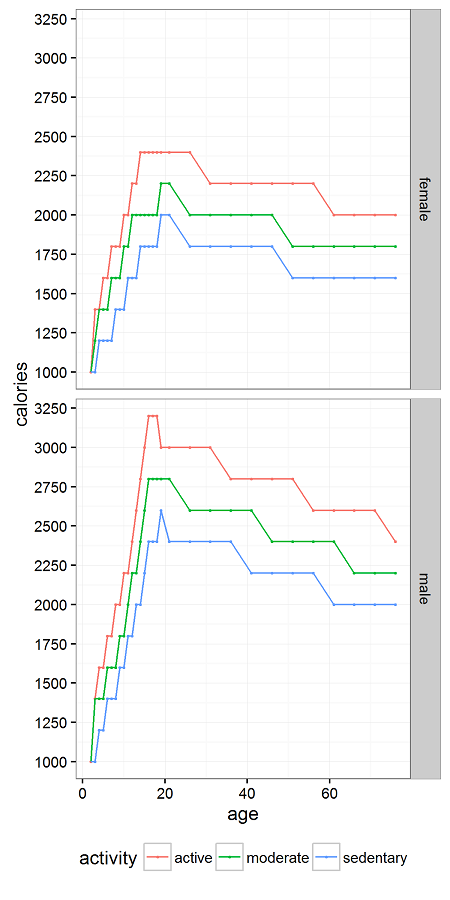
The result is above. If you have any ideas on how to fit it elegantly, let us know.
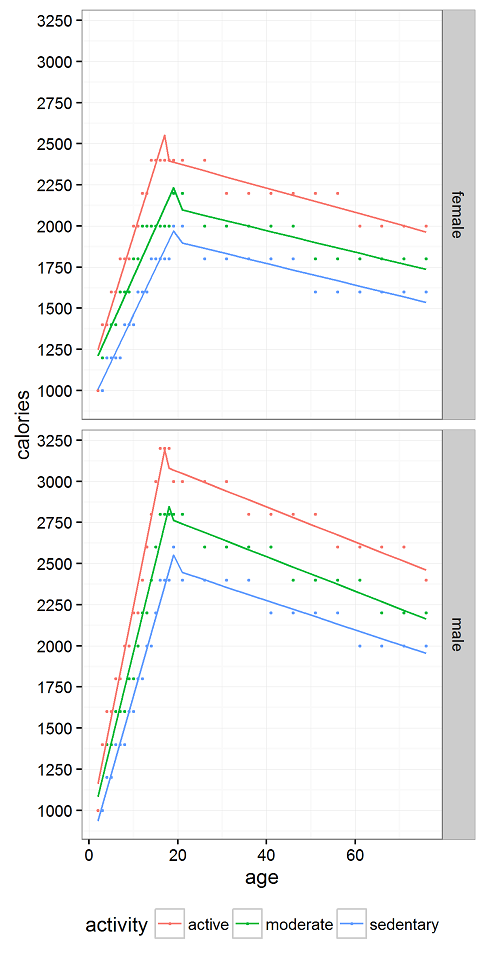
We tried a number of fits. Lines are good for heuristics, so we made a bi-linear fit to the raw data (in points). We’re all grownups reading this blog, so let’s focus on the lines to the right of the peak.
Time to make the heuristics. For women, you need about 65 fewer calories per day for every decade after age 20. For men, you need about 105 fewer calories per day for every decade after age 20. Or let’s just say 70 and 100 to keep it simple.
So, if you have an opposite sex life partner (OSLP?), keep in mind that you may need to cut back by more or fewer calories as the person across the table as you age together. Same sex life partner (SSLP?), cut back the same amount. Just don’t go beyond the range of the chart. The guidelines suggest even sedentary men shouldn’t eat fewer than 2,000 calories a day at any age. For women, that number is 1650.
REFERENCES
Barrio, Pablo J., Daniel G. Goldstein, & Jake M. Hofman. (2016). Improving comprehension of numbers in the news. ACM Conference on Human Factors in Computing Systems (CHI ’16). [Download]
The R code, below, has some other attempts at plots in it. You may be most interested in it as a way to see rvest in action. Or just to get the data.


