R gets some -E-S-P-E-C-T
NEW YORK TIMES STORY ON THE APPEAL OF R
(click to view movie)
It is no secret that Decision Science News is crazy about the R language for statistical computing. Find out why R is so great in this New York Times article. Then start to teach yourself R with our short series of video tutorials.
- Decision Science News R Video Tutorial Number 1
- Decision Science News R Video Tutorial Number 2
Addendum: Check out the hordes of R supporters in this comments of this Freakonomics blog post, correcting an assumption by Ayers that happens to be 180 degrees in the wrong direction.
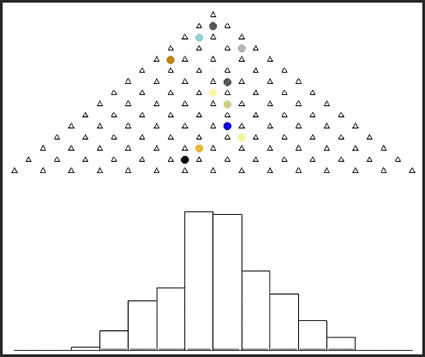
Animation credit: Friend of Decision Science News Yihui Xie.


I’d like to contribute the draft source code for the Quincunx here (which will be included in the R package “animation” later):
par(mar = c(1, 0.1, 0.1, 0.1))
balls = 200
layers = 15
pch.layers = 2
pch.balls = 19
col.balls = sample(colors(), balls, TRUE)
cex.balls = 2
nmax = balls + layers – 2
interval = 0.05
layerx = layery = NULL
for (i in 1:layers) {
layerx = c(layerx, seq(0.5 * (i + 1), layers – 0.5 * (i –
1), 1))
layery = c(layery, rep(i, layers – i + 1))
}
ballx = bally = directx = matrix(nrow = balls, ncol = nmax)
finalx = numeric(balls)
for (i in 1:balls) {
directx[i, i] = 0
ballx[i, i] = (1 + layers)/2
if (layers > 2) {
tmp = rbinom(layers – 2, 1, 0.5) * 2 – 1
directx[i, i + 1:(layers – 2)] = tmp
ballx[i, i + 1:(layers – 2)] = cumsum(tmp) * 0.5 + (1 +
layers)/2
}
bally[i, (i – 1) + 1:(layers – 1)] = (layers – 1):1
finalx[i] = ballx[i, i + layers – 2]
}
rgx = c(1, layers)
rgy = c(0, max(table(finalx)))
for (i in 1:nmax) {
par(mfrow = c(2, 1))
plot(1:layers, type = “n”, ann = FALSE, axes = FALSE)
points(layerx, layery, pch = pch.layers)
points(ballx[, i], bally[, i], pch = pch.balls, col = col.balls, cex = cex.balls)
par(bty = “u”)
if (i < layers – 1)
plot.new()
else hist(finalx[1:(i – layers + 2)], breaks = 1:layers,
xlim = rgx, ylim = rgy, main = “”, xlab = “”, ylab = “”,
ann = FALSE, axes = FALSE)
Sys.sleep(interval)
}
January 12, 2009 @ 3:55 pm
Thanks, Yihui
January 12, 2009 @ 6:41 pm
There was also a follow-up posting by the same author at the New York Times’ blog, and it has generated some lively discussion in the comments. You can find it here:
http://bits.blogs.nytimes.com/2009/01/08/r-you-ready-for-r/
January 13, 2009 @ 7:50 pm