How to eyeball a standard deviation
 Subscribe to Decision Science News by Email (one email per week, easy unsubscribe)
TEST YOUR ESTIMATION SKILLS
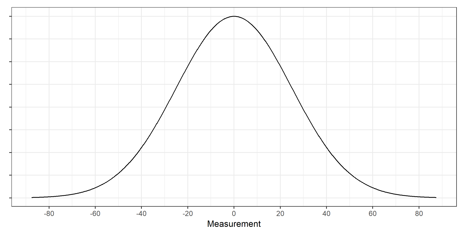
Suppose you are looking at the roughly normally distributed data above and you want to visually estimate the standard deviation.
What would you guess? 20? 35?
How would you do it?
In a past post we talked about tips for drawing a normal distribution.
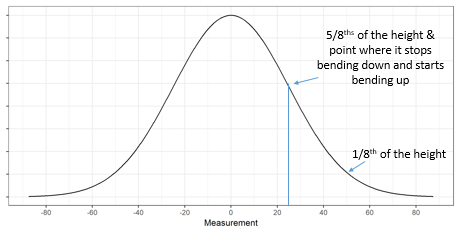
In it, we noted that if you follow a normal curve to 5/8ths of the height of the bell, you’ll be at the ± 1 standard deviation marks.
So just measure up 5/8ths (we’ve drawn gridlines to make that easy), drop a line down to the x-axis and read off the standard deviation (making a small adjustment if it’s not 0 centered).
If you don’t like estimating 5/8ths, you can also try to identify the inflection point in the bell curve: the place where it goes from bending down to bending up. That occurs at exactly ± 1 standard deviations.
Applying those heuristics here, we’d estimate the standard deviation on this chart to be about 25 … and it is 25!
Another way to do this is to identify the range that encompasses about 99% of the data and divide by 6. Here the measurements run from -80 to 80 or about 160 units. This divided by 6 is 26.67.
Not too bad!
R CODE TO REPRODUCE CHARTS


