Inference for R
CREATE AUTOMATICALLY UPDATED R CHARTS AND TABLES INSIDE WORD & EXCEL

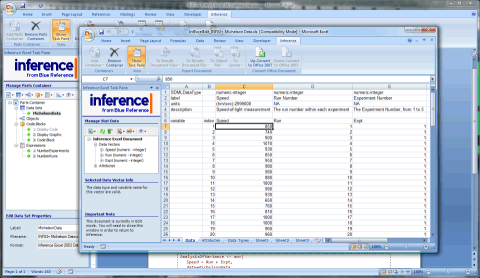
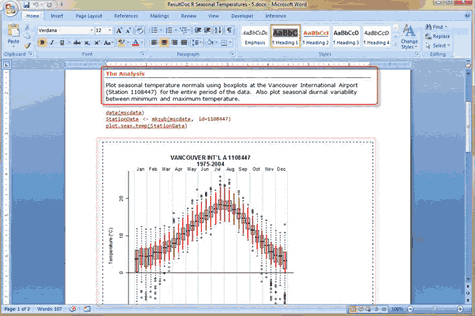
Decision Science News’ imagination has been recently captured by an innovative product called Inference for R. (R as in the open-source language for statistical computation.) To use it, you simply insert some code into your Microsoft Office documents. The Inference product connects to the R engine on your computer and outputs the results of the computation directly into your Word doc or Excel spreadsheet. It even works for plots, as shown below:

The 2 minute video walk-through is informative. Since most DSN readers are academics, they might be happy to know that there is a free one-year academic license.
If you are interested in learning R, don’t miss the excellent:


[…] enclose some code into your Microsoft Position documents. The Illation product connects to the Continued… Share […]
March 26, 2009 @ 2:01 am
how did you create that uncertainty plot? I mean Microsoft Excel, as far as I know, doesn’t plot error-bars!
Farhood Azarsina
April 8, 2009 @ 12:24 pm
That is a good question Farhood, as it illustrates the value of using Inference with Excel and Word. As you pointed out, Excel and Word do not supply the capability to construct the boxplots shown in the example. Inference allows you to declare R requests (e.g., the plot that is shown in the example) from within the familiar environment of Microsoft Word, Excel, and soon PowerPoint. Inference will then execute these requests in the background and insert them into the appropriate places in the Excel/Word documents. The bottom line is that Inference broadly extends the capabilities of Excel/Word by leverages the power of the R open-source statistical software.
April 22, 2009 @ 5:39 pm