CALL FOR PROPOSALS, DEADLINE SEPTEMBER 10, 2018

The 11th Triennial Invitational Choice Symposium, co-chaired by Simon
Blanchard and Debora V. Thompson from Georgetown University, will be
held from May 29th to June 2nd 2019, at the Hyatt Regency Chesapeake
Bay Resort located on the Eastern shore in Maryland.
Scholars who are interested in organizing a workshop on a specific
theme for the symposium may submit a proposal by September 10th, 2018.
Workshop Topics: Workshop proposals should focus on the study of
topics relevant to the understanding of individual choice behavior and
decision making, ideally spanning multiple academic disciplines.
Workshop Schedule: The symposium typically includes 2.5 days of
scheduled academic activities and one half day of leisure activities.
Typical schedules include time for participants to present their own
work and have ample time for integrative discussions. Sample proposals
from past symposiums are available on the symposium website.
Workshop Participants: Workshop organizers are responsible for
recruiting a roster of participants for their proposed session. Each
workshop proposal should include a minimum of 12 and a maximum of 15
participants – inclusive of the organizers.
Submission deadline: Workshop proposals must be submitted by September
10th 2018. Proposal review: Submitted workshop proposals will be reviewed and
evaluated by members of the program committee, and decisions will
communicated to the corresponding workshop co-organizers by November
15, 2018. For more information, visit http://www.choicesymposium.org
JCP DEADLINE FOR INITIAL MANUSCRIPT SUBMISSION: AUGUST 1, 2019

Every day, consumers make a myriad of decisions that have the ability to affect the greater good, which we define as the collective well-being of the broader social group. Such decisions range from deciding whether or not to speak up in the face of unfair practices to accurately reporting one’s financial information on their taxes to understanding and empowering vulnerable consumers. Given their broad communal consequences, such decisions are of great interest to a variety of constituencies, including policy makers, non-profit organizations, communities, and marketers, as well as individuals. Accordingly, theory-driven inquiry into the antecedents and consequences of consumer behaviors that serve the greater good offers great theoretical and practical value.
Consumer psychology over the past several decades has made substantive contributions to the understanding of consumer behavior; however, research truly motivated by impacting the greater good has remained limited. To be clear, there is a difference between research motivated by the greater good versus research that is relevant to the greater good. In the former, the genesis of the research is a problem motivated by the greater good; in the latter, the greater good might be referenced as a loosely-related implication drawn from a broader inquiry. This Special Issue in JCP seeks research that fits the former category.
The research could propose novel theories of how to promote the greater good, question whether outcomes stereotypically thought of as generating greater good indeed serve the greater good, or even propose downstream problems that a quest for greater good might create. Applications of existing consumer decision making theories to promote the greater good are welcome, but only as long as a greater good problem is central to the paper and the application is consequential.
Submitted manuscripts could either be Research Reports or Research Articles in standard JCP format. All submissions are encouraged to provide complete methodological and other details in accompanying web appendices. To see the full call for papers, including a list of potential (non-binding) areas of investigation, visit: https://www.jcpthegreatergood.com/
Deadline for initial manuscript submission: August 1, 2019. Authors are encouraged to submit manuscripts early and any time before the submission deadline as papers will be evaluated on a rolling basis.
Co-Editors: Kelly Goldsmith & Aparna A. Labroo
HELP SHAPE THE NEXT GENERATION OF INTELLIGENCE ANALYSIS TOOLS

IARPA (the Intelligence Advanced Research Projects Activity) seeks thousands of people to test the analytic methods developed for the CREATE (Crowdsourcing Evidence, Argumentation, Thinking and Evaluation) program.
CREATE is a multi-million-dollar, multi-year R\&D effort to improve the core process of intelligence analysis for national security: making well-reasoned inferences from incomplete information. If effective, CREATE analytic tools could greatly assist other disciplines that depend on good reasoning, including law, medicine, and public policy.
The Create Better Reasoning Study seeks people to test innovative reasoning and problem solving tools. Ideal participants like to Learn new tools and techniques to evaluate and share evidence Develop well-reasoned, evidence-based solutions to complex problems Explain their reasoning clearly and convincingly
Participants will spend 2-3 hours/week for 9 weeks working alone or in teams to discuss, develop and document solutions to challenging problems. Along the way, you will learn and use special software that helps with CRowdsourcing Evidence, Analysis, Thinking and Evaluation (CREATE).
You can join CREATE if you
Are 18 or older
Have at least some college education
Read and write English fluently
Have reliable internet access and will accept cookies from the study website
Your contribution could shape the future of intelligence and problem solving tools.
Ready to Join?
Here is the signup page.
Filed in
Ideas
 Subscribe
 to Decision Science News by Email (one email per week, easy unsubscribe)
DIGGING THE JUST NOTICEABLE DIFFERENCE

We were getting an egg and cheese on a roll at a deli the other day and started chatting with the cashier about politics and he said that two people were like 19 vs 20.
We said, “19 vs 20, what’s that mean?”
He said, “It means basically the same thing. Different but not really different”
We said, “Where do they say that?”
He said, “Pakistan”
As we continued walking to work, we were thinking “this is the best saying ever.”
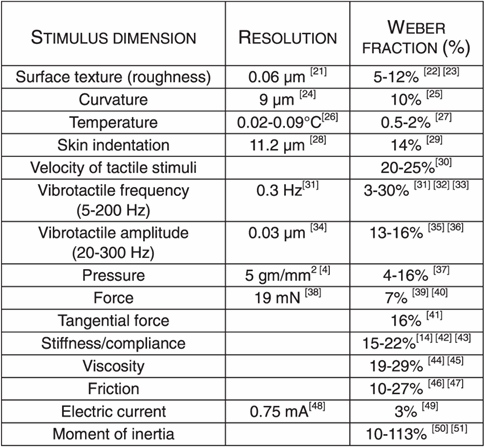
In the psychology of sensation and perception, differences in sensation of 5% (e.g., 19 vs 20) are often not detectable. People can’t reliably tell if a rock that weighs 19 pounds is heavier or lighter than a rock that weighs 20 pounds. If the threshold for detecting differences is k, k is called the Weber fraction. Here’s are some estimated Weber fractions (as percentages) for a number of stimulus dimensions:
Source
As we can see, in many domains, k is greater than 5%, meaning that for many things, the 19 vs 20 difference is not detectable.
Next, we wanted to see if we could find some web pages on this topic, you know, for blogging.
Searching on “19 vs 20” in English was not a successful search strategy.
We thought, well, maybe if it’s said in Pakistan, it’s said in India, too? We asked a couple of Indian colleagues in the lab and bingo, both knew the phrase. In Hindi, it’s “unees bees ka fark”:
unees means ‘nineteen’
bees means ‘twenty’
ka fark means ‘the difference between’
My colleague Chinmay Singh adds the following
There is question on Quora about this topic:
https://www.quora.com/What-is-the-English-of-Unees-bees-ka-fark
The exact words can be loosely translated as “difference of nineteen twenty”, as in the difference between two things being compared is the same as that between nineteen and twenty.
Please note there is subtle difference between this idiom and the English variant “six of one, half a dozen of the other”. The Hindi phrase acknowledges that the difference actually exists, but should be ignored because it is (statistically) insignificant. The English phrase suggests that it’s only a matter of saying it differently as the two choices are identical otherwise.
NOTES:
- While we wish the Weber fraction was named for JDM researcher Elke Weber, it’s actually named for Ernst Heinrich Weber who died unfortunately in 1878.
- The ideas of the just noticeable difference and Weber fraction are useful but false models that have been supplanted. When we wrote a term paper on the topic for Stephen Stigler’s History of Statistics class, we learned about the 1885 attack on the just noticeable difference (unterschiedsschwelle) by Charles Sanders Peirce and Joseph Jastrow.
- As the image above shows, “nineteen twenty” is the name of an awesome looking movie as well.
Filed in
Conferences
 Subscribe
 to Decision Science News by Email (one email per week, easy unsubscribe)
SUBMISSION DEADLINE MAY 1, 2018

The upcoming Foundations of Utility and Risk Conference (FUR 2018) is being held at the University of York, UK from Monday 25 June to Thursday 28 June.
FUR conferences were started in Oslo in 1982 by Ole Hagen and Maurice Allais, and have been held every two years since. It is a highly prestigious conference with many distinguished presenters and participants. Each year FUR invites abstracts for presentations and posters on any topic related to risk, and, more generally, decision theory.
We are writing to you now as the deadline for the second round of submissions – Tuesday the 1st of May – is approaching fast. The first round has already passed – we had almost 200 submissions and we have accepted a sizeable majority of them. The programme is filling up nicely. We will communicate decisions on the second round by the 7th of May, in time for you to register before the early registration deadline of the 14th of May (after which registrations go up from £300 to £400 (full) and from £200 to £300 (student)), and also in time for you to take advantage of pre-booked hotel rooms offered by our Registration Agency, Mosaic (available up to the 10th of May). There will be a third round of submissions opening on Thursday 8 May and closing on Monday 21 May, with decisions communicated by Thursday 31 May – but this will be too late to register at the lower fees. We advise you to submit soon.
We have distinguished plenary speakers: Lara Buchak (UC Berkeley), Ido Erev (Technion – Israel Institute of Technology) and Ariel Rubinstein (Tel Aviv University, New York University) as well as our ‘Rising Star’ Terri Kneeland (University College London). There will also be Round Table discussions on specialised topics chaired by: Ani Guerdjikova (University of Grenoble Alpes): Ambiguity in Dynamic Interactions: Can Economists Give Precise Advice with Imprecise Probabilities?; Paulo Natenzon (Washington University in Saint Louis): Attention: Limited?; and Wlodek Rabinowicz (Lund University): Dynamic Decisions beyond EU.
We are trying to make the conference as interdisciplinary as possible, with economics, philosophy and psychology being covered by the invited speakers. Other disciplines, related to the conference theme, will also be welcome.
You can register now for the conference, and find out more about submission of abstracts online.
ACROSS ALL TIMES, DAYS, AND PLACES

We were up at Yale the other week guest lecturing for Shane Frederick, who always hits us up with trivia questions. Here’s one question he asked us:
What’s the average temperature on the earth?
That is, what’s the average surface temperature over all places on the earth (inhabited or not), over all times of day, over all days of the year. Roughly speaking, what’s the average value on a graph like this? [Y axis values are temperatures that we’ve hidden]
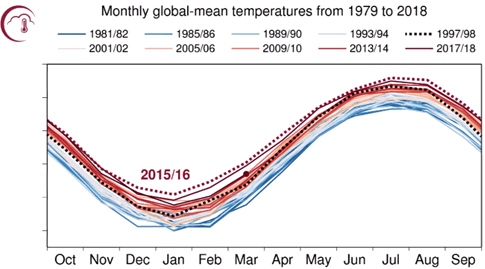
Spoiler alert: If you want to see the Y-axis values for the graph, click on it.
As the average temperature is changing and fuzzy statistic, so we’ll accept a rough guess via a multiple choice item.
Which of A – J represents the average surface temperature on the earth (in Fahrenheit)?
A) 36
B) 43
C) 50
D) 57
E) 64
F) 72
G) 79
H) 86
I) 93
J) 100
Or if you are more comfortable with Celsius:
A) 2
B) 6
C) 10
D) 14
E) 18
F) 22
G) 26
H) 30
I) 34
J) 38
Want the answer? Go to this page and scroll down to the 2nd to last line, where it says “For the global mean, the most trusted models produce a value of roughly …”
As insurance against that page moving, we’ll leave an Internet Archive link here.
Filed in
Conferences
 Subscribe
 to Decision Science News by Email (one email per week, easy unsubscribe)
HOW DIGITIZATION CHANGES BEHAVIOR AND BUSINESS

There will be a pre-conference on Digitized Behavior at Boston University, right before the 2018 BDRM conference.
Each talk examines how digitization changes behavior and business.
Speakers:
Adrian Ward, University of Texas at Austin
Alix Barasch, New York University
Andrey Fradkin, Massachusetts Institute of Technology
Avi Goldfarb, University of Toronto
Berkeley Dietvorst, University of Chicago
Daniella Kupor, Boston University
Eva Buechel, University of South Carolina
Fleura Bhardi, City University of London
Frederic Brunel, Boston University
Iyad Rahwan, Massachusetts Institute of Technology
Kostadin Kushlev, University of Virginia
Leslie John, Harvard Business School
Molly Crockett, Yale University
Sandra Matz, Columbia University
Todd Rogers, Harvard Kennedy School
Veronica Marotta, Carnegie Mellon University
The preconference runs from 9am to 4pm on Thursday, June 7th, 2018 in the auditorium of the Questrom School of Business, 595 Commonwealth Ave, Boston, MA 02215.
Lunch will be provided. How cool is that!?
Registration is free while space is available. You can register now here.
The preconference is organized by the Marketing Department at the Questrom School of Business. Please direct questions to nishibun at bu.edu.
1.6 MILLION SQUARE KILOMETERS OF GARBAGE IN PERSPECTIVE
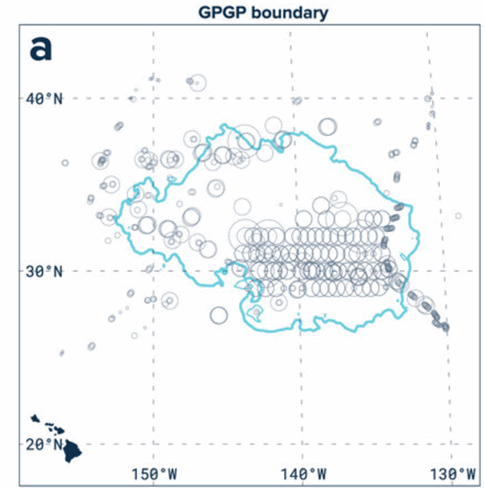
This Nature Scientific Reports article gives an update on the size of the Great Pacific Garbage Patch. It is estimated to be four to 16 times larger than previously estimated: 1.6 million square kilometers.
While the article does show the patch along with latitude and longitude lines (above) and the Hawaiian islands, it doesn’t provide much help communicating how large it is with familiar reference objects. (Incidentally, our research has found that people seriously underestimate the size of Hawaii).
How large is 1.6 million square kilometers? It’s about
- As big as Alaska
- One-fifth as big as the contiguous United States
- Half as big as India
- As big as Iran
Open to suggestions for how to put into perspective the estimated mass of the plastic: 80,000 metric tons.
REFERENCE
Lebreton et al. (2018). Evidence that the Great Pacific Garbage Patch is rapidly accumulating plastic. Scientific Reports.
h/t Stefano Puntoni
Filed in
Ideas
 Subscribe
 to Decision Science News by Email (one email per week, easy unsubscribe)
RUTH VS DIMAGGIO
We were looking up the wording of a joke we wanted to tell our kids:
A guy has a talking dog. He brings it to a talent scout. “This dog can speak English,” he claims to the unimpressed agent. “Okay, Sport,” the guys says to the dog, “what’s on the top of a house?” “Roof!” the dog replies. “Oh, come on…” the talent agent responds. “All dogs go ‘roof’.” “No, wait,” the guy says. He asks the dog “what does sandpaper feel like?” “Rough!” the dog answers. The talent agent gives a condescending blank stare. He is losing his patience. “No, hang on,” the guy says. “This one will amaze you. ” He turns and asks the dog: “Who, in your opinion, was the greatest baseball player of all time?” “Ruth!” goes the dog. And the talent scout, having seen enough, boots them out of his office onto the street. And the dog turns to the guy and says “Maybe I shoulda said DiMaggio?”
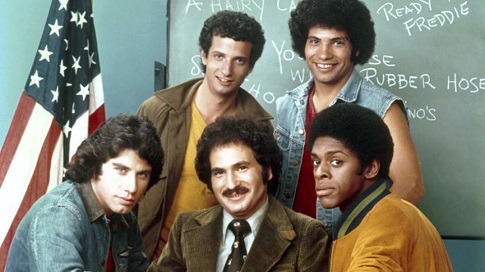
Hilarious, right? You’re welcome. For some reason, we remember this being told by Gabe Kaplan in an episode of Welcome Back Kotter but we can’t find evidence of this online.
The reason for this post, however, was the web page we found the wording on. Professor of Computer Science / Cognitive Science professor Justin Li thinks about the joke in terms of the Wason selection task. Have a look.
It does seem the talent agent is wary of the reasoning fallacy called affirming the consequent, the Wikipedia example of which is:
If Bill Gates owns Fort Knox then Bill Gates is rich.
Bill Gates is rich
Ergo, Bill Gates owns Fort Knox
In the context of this joke, you don’t want to reason
If the dog can speak English, the dog can answer the questions
The dog can answer the questions
Ergo, the dog can speak English
THAT’S ONE WAY TO GET “A” PAPERS FROM YOUR FACULTY
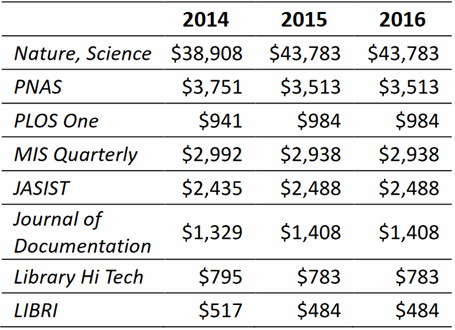
Table 5 Comparison of Average Amount of Cash Awards for a Paper Published in Selected Journals
When we first saw this image on Facebook, we thought it was a joke. But then we downloaded the paper and found that indeed, there’s a practice of paying authors based on the journal that publishes the paper.
“In summary, Chinese universities differentiate the amount of cash reward based on the JIF and JCR Quartile of journals in which the awarded papers are published. The average amount of cash award has increased over the past 10 years, except that the amount awarded to papers published in journals with low JIF has decreased. Publications in Nature and Science are awarded the largest amount of cash reward.” – Page 13
We’re now waiting for someone to write a web app that scrapes CVs and puts dollar values on them.
REFERENCE
Quan, Wei, Bikun Chen, and Fei Shu (working paper). Publish or impoverish: An investigation of the monetary reward system of science in China (1999-2016).
SEE ALSO
https://www.technologyreview.com/s/608266/the-truth-about-chinas-cash-for-publication-policy/
h/t Andreas Ortmann
 Subscribe to Decision Science News by Email (one email per week, easy unsubscribe)


