Filed in
Programs
 Subscribe
 to Decision Science News by Email (one email per week, easy unsubscribe)
AT DUKE UNIVERSITY, APPLICATION DEADLINE FEBRUARY 19, 2018

From the evening of Sunday, June 17 to the morning of Saturday, June 30, 2018, the Russell Sage Foundation will sponsor the Summer Institute in Computational Social Science, to be held at Duke University. The purpose of the Summer Institute is to bring together graduate students, postdoctoral researchers, and beginning faculty interested in computational social science. The Summer Institute is for both social scientists (broadly conceived) and data scientists (broadly conceived). The co-organizers and principal faculty of the Summer Institute are Christopher Bail and Matthew Salganik.
The instructional program will involve lectures, group problem sets, and participant-led research projects. There will also be outside speakers who conduct computational social science research in academia, industry, and government. Topics covered include text as data, website scraping, digital field experiments, non-probability sampling, mass collaboration, and ethics. There will be ample opportunities for students to discuss their ideas and research with the organizers, other participants, and visiting speakers. Because we are committed to open and reproducible research, all materials created by faculty and students for the Summer Institute will be released open source.
Participation is restricted to Ph.D. students, postdoctoral researchers, and untenured faculty within 7 years of their Ph.D. Most participant costs during the workshop, including housing and most meals, will be covered, and most travel expenses will be reimbursed up to a set cap. About thirty participants will be invited. Participants with less experience with social science research will be expected to complete additional readings in advance of the Institute, and participants with less experience coding will be expected to complete a set of online learning modules on the R programming language. Students doing this preparatory work will be supported by a teaching assistant who will hold online office hours before the Institute.
Application materials should be received by Monday, February 19, 2018.
A COMPETITION FOR THE BEST IDEAS TO IMPROVE FINANCIAL SECURITY
Behavioral economists and financial services firms may be interested in The Financial Inclusion Challenge new competition.
Financial security is beyond the reach of millions of Americans. Nearly one-fourth of adults can’t pay their monthly bills, and roughly the same number have little or no access to a bank. Many have no retirement savings or aren’t sure how to manage them. Financial insecurity damps growth and prosperity in the consumer-driven U.S. economy.
The Wall Street Journal’s Financial Inclusion Challenge, sponsored by MetLife Foundation, is seeking entries from for-profit and nonprofit enterprises whose products or services help to improve financial resilience, via innovative, scalable, sustainable and socially positive solutions.
Enter the competition
Deadline: Noon ET, Friday, Feb. 23, 2018
Three finalists, selected by a panel of independent judges, will be announced March 19. The winner will be selected at a Wall Street Journal event the week of May 7.
The Financial Inclusion Challenge is part of a Wall Street Journal initiative to highlight Americans’ struggles in managing personal finances. A series of video reports and finalist profiles will be published on WSJ.com between January and May. The finalists will be invited to join the audience at D.LIVE, the Journal’s technology conference, Nov. 12-14, in Laguna Beach, Calif.
See the full competition rules
Send questions to financialinclusion@wsj.com
Filed in
Conferences
Subscribe to Decision Science News by Email (one email per week, easy unsubscribe)
DEADLINE SOON, BUT ONLY A SHORT ABSTRACT NEEDED

The 56th Edwards Bayesian Research Conference will be held March 1-3, 2018, on the campus of California State University, Fullerton.
Presentations at this conference may come from any area related to judgment and decision making and are NOT limited to Bayes theorem or Bayesian statistics.
Submissions are due by January 15, 2018.
We maintain certain traditions that have made these meetings so enjoyable. As Ward Edwards put it, “…the atmosphere is informal, the discussion can get intense, and many of the best debates take place during coffee breaks or in the hospitality suite at the end of the day. This conference is a good place to try out your latest, wildest set of ideas on a kindly, knowledgeable, and critical audience.”
Hotel rooms will be available at an excellent rate at the Fullerton Marriott, which is across the street from the meeting room.
Visit the conference website for more information
Questions can be sent to Daniel Cavagnaro: dcavagnaro@fullerton.edu
WINNERS GET TO BE CO-AUTHORS ON THE PAPER

Ori Plonsky, Reut Apel, Ido Erev, Eyal Ert, and Moshe Tennenholtz announce
You are invited to participate in the 2018 choice prediction competition (CPC18) for human decision making. The main goal of this competition is to improve our understanding of the ways by which behavioral decision research can contribute to the derivation of useful predictions of human decision making, above and beyond what is possible using data-driven machine learning tools (if at all possible).
CPC18 distinguishes between two very different prediction tasks: predicting the aggregate population behavior in an unfamiliar choice problem, and predicting the individual behavior in a familiar choice problem. Specifically, CPC18 includes two parallel competition tracks, and you are invited to participate in either one, or better yet, in both. A second goal of the competition is to then understand what type of models are better suited to handle each type of task.
The rules of the competition and further details are given in https://cpc18.wordpress.com. A white paper summarizing the current stage of the competition is provided here. The deadline for final submissions is May 12, 2018 (but for one of the tracks, a partial submission must be made by May 8th; see website for details). To compete, you are required to register by April 10th.
As in some of the previous choice prediction competitions, the prize for the winners is an invitation to be a co-author of the paper that summarizes the competition.
The competition’s basic idea is as follows. We previously collected a large dataset of human choices between monetary gambles, under risk and under ambiguity, with and without feedback. This dataset includes over 500,000 individual consequential choices. Almost all of this data is publicly available at https://zenodo.org/record/845873#.WeDg9GhSw2x, and can (and probably should) be used to develop and train your predictive models.
In those experiments, each decision maker faced many problems, and the two tracks differ with respect to the exact prediction challenge:
In the track Individual behavior, familiar problems the task is to predict the individual behavior of a small portion of these decision makers in some of the problems they faced. Therefore, a small portion of the data already collected will be used as the competition data in that track and is thus not available. The goal in this track is to predict, as accurately as possible, the individual behavior reflected in that data.
In the track Aggregate behavior, unfamiliar problems the task is to predict the aggregate choice rates in a new experiment with new problems that we will run (during March-April 2018). As in some of the previous choice prediction competitions, the submissions should be computer programs that read the parameters of the choice problems as input, and derive the predicted choice rates as output.
We hope that you are up for the challenge!
Photo credit: https://flic.kr/p/4jbFC8
Filed in
SJDM
Subscribe to Decision Science News by Email (one email per week, easy unsubscribe)
SOCIETY FOR JUDGMENT AND DECISION MAKING NEWSLETTER

The quarterly Society For Judgment and Decision Making newsletter is ready for download:
http://sjdm.org/newsletters/
BAGEL SHOP IDEA

I was sitting in a bagel shop on Saturday with my 9 year old daughter. We had brought along hexagonal graph paper and a six sided die. We decided that we would choose a hexagon in the middle of the page and then roll the die to determine a direction:
1 up (North)
2 diagonal to the upper right (Northeast)
3 diagonal to the lower right (Southeast)
4 down (South)
5 diagonal to the lower left (Southwest)
6 diagonal to the upper left (Northwest)
Our first roll was a six so we drew a line to the hexagon northwest of where we started. That was the first “step.”
After a few rolls we found ourselves coming back along a path we had gone down before. We decided to draw a second line close to the first in those cases.
We did this about 50 times. The results are pictured above, along with kid hands for scale.
I sent the picture to my friend and serial co-author Jake Hofman because he likes a good kid’s science project and has a mental association for everything in applied math. He wrote “time for some Brownian motion?” and sent a talk he’d given a decade ago at a high school which taught me all kind of stuff I didn’t realize connecting random walks to Brownian motion, Einstein, the existence of atoms and binomial pricing trees in finance. (I was especially embarrassed not to have mentally connected random walks to binomial pricing because I had a slide on that in my job talk years ago and because it is the method we used in an early distribution builder paper.)
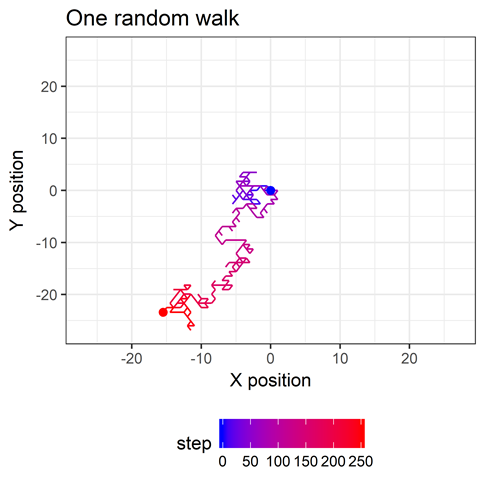
Back at home Jake did some simulations on random walks in one dimension (in which you just go forward or backward with equal probability) and sent them to me. Next, I did the same with hexagonal random walks (code at the end of this post). Here’s an image of one random walk on a hexagonal field.
I simulated 5000 random walks of 250 steps, starting at the point 0,0. The average X and Y position is 0 at each step, as shown here.
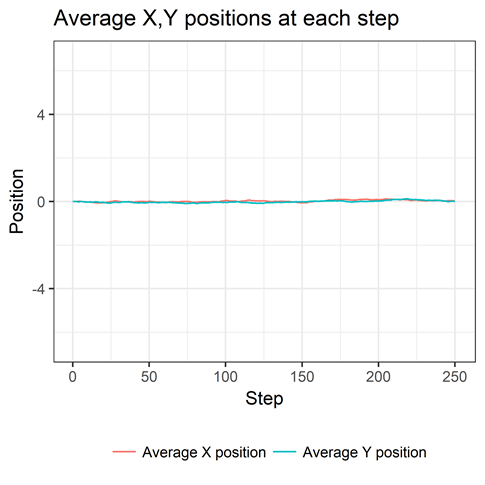
This might seem strange at first. But think about many walks of just one step. The number of one-step journeys in which your X position is increased a certain amount will be matched, in expectation, by an equal number of one-step journeys in which your X position is decreased by the same amount. Your average X position is thus 0 at the first step. Same is true for Y. The logic scales when you take two or more steps and that’s why we see the flat lines we do.
If you think about this wrongheadedly you’d think you weren’t getting anywhere. But of course you are. Let’s look at your average distance from the starting point at each step (below).

The longer you walk, the more distant from the starting point you tend to be. Because distances are positive, the average of those distances is positive. We say you “tend to” move away from the origin at each step, because that is what happens on average over many trips. At any given step on any given trip, you could move towards or away from the starting point with equal probability. This is deep stuff.
Speaking of deep stuff, you might notice that the relationship is pretty. Let’s zoom in.

The dashed line is the square root of the number of steps. It’s interesting to note that this square root relationship happens in a one-dimensional random walk as well. There’s a good explanation of it in this document. As Jake put it, it’s as if the average walk is covered by a circular plate whose area grows linearly with the number of steps. (Why linearly? Because area of a circle is proportional to its radius squared. Since the radius grows as the square root of the number of steps, the radius squared is linear in the number of steps)
(*) As a sidenote, I was at first seeing something that grew more slowly than the square root and couldn’t figure out what the relationship was. It turns out that the square root relationship holds for the root mean squared distance (the mean of the squared distances) and I had been looking at the mean Euclidean distance. It’s a useful reminder that the term “average” has quite a few definitions. “Average” is a useful term for getting the gist across, but can lead to some confusion.
Speaking of gists, here’s the R code. Thanks to @hadleywickham for creating the tidyverse and making everything awesome.
RCODE
Filed in
Conferences
Subscribe to Decision Science News by Email (one email per week, easy unsubscribe)
BDRM SUBMISSION DEADLINE DECEMBER 29, 2017

What: Behavioral Decision Research in Management (BDRM) Conference
When: June 7-9, 2018
Where: Harvard Business School, Harvard University
Submission Deadline: December 29, 2017
CONFERENCE CO-CHAIRS:
Max Bazerman, Alison Wood Brooks, Ryan Buell, Francesca Gino, Leslie John, Elizabeth Keenan, Anat Keinan, Julia Minson, Mike Norton, Todd Rogers, and Shelle Santana
We invite submissions of papers for the 16th biennial conference on Behavioral Decision Research in Management, to be held at Harvard Business School, Boston, MA, on June 7-9, 2018.
BDRM is the leading conference for behavioral research with business and organizational implications. We encourage submissions of original work in all areas of behavioral research including, but not limited to, the areas of decision-making, consumer behavior, experimental and behavioral economics, decision analysis, behavioral finance, organizational behavior, negotiation, behavioral strategy, behavioral operations research, behavioral accounting, and medical and legal decision making.
We are happy to announce the following keynote speakers:
- Teresa Amabile, Baker Foundation Professor and Edsel Bryant Ford Professor of Business Administration, Emerita at Harvard Business School
- Paul Rozin, Professor of Psychology at the University of Pennsylvania
SUBMISSION INFORMATION AND DEADLINES FOR THE BDRM CONFERENCE
Submissions for the BDRM conference are due by December 29, 2017. Notification of acceptances will be sent in late March 2018.
Abstracts should include a brief description of the research problem, the key methodology and assumptions, and a summary of major results and implications. Abstracts will be selected for oral presentation by blind review (no author names or affiliations should appear on the abstracts).
Abstracts should not exceed three (3) pages double-spaced, Times New Roman, font size 12, and can be submitted in Word or .pdf format. No math symbols should be used and tables and diagrams should be minimal.
Each participant may present only one paper. When submitting papers to this conference, you must agree to be available at any time on June 8 and June 9, 2018 to give your presentation. If you will not be available on one of these days, please arrange for a co-author to give the presentation. We will not consider date/time change requests for presentations.
We will be grouping competitive papers into 75-minute sessions, containing four papers each. Each author will have approximately 15 minutes to present their work. The last 15 minutes will be dedicated to questions.
Papers accepted by the reviewers will be conditionally accepted until at least one author registers for the conference.
You may submit your paper here
The conference website provides additional information about the conference, including accommodations
Filed in
Jobs
Subscribe to Decision Science News by Email (one email per week, easy unsubscribe)
APPLICATION DEADLINE JANUARY 1, 2018

Microsoft Research New York City investigates computational social science, algorithmic economics and prediction markets, machine learning, and information retrieval. We do cutting-edge, multidisciplinary research, both theoretical and applied, with access to an extraordinary diversity of big and small data sources, an open publications policy, and close links to top academic institutions around the world.
We are looking for postdoctoral researchers in the area of computational social science with strong quantitative and programming skills. Postdocs are typically hired for a two-year term appointment following the academic calendar, starting in July 2018. Applicants must have completed the requirements for a PhD, including final submission of their dissertation, prior to joining Microsoft Research. Applicants with tenure-track offers from other institutions will be considered, provided they are able to defer their start date to accept our position.
Basic qualifications:
- PhD in computer science, statistics, math or a related quantitative social science field
- Strong mathematical and programming skills
Preferred qualifications:
- Awareness of the theoretical and experimental social science literature
- Advanced knowledge of statistics, econometrics, and experimental design
HOW TO APPLY
If you meet the basic and preferably preferred qualifications above, please visit:
https://www.microsoft.com/en-us/research/opportunity/postdoctoral-researcher-css/
for information on applying.
CROWDSOURCING RESEARCH
We have been meaning to post, for quite some time, about this very interesting report from Nature entitled Crowdsourced research: Many hands make tight work. In it, the authors describe how a finding of theirs didn’t hold up when re-analyzed by the Uri Simonsohn. Instead of digging in their heels, they admitted Uri was right and realized there’s wisdom in having other people take a run at analyzing a data set as they might discover better ways of doing things.
They wondered if, in a wisdom-of-the-crowds fashion, whether aggregating multiple, independent analyses might lead to better conclusions. (We at Decision Science News would expect such an effect would be enhanced when working with a selected crowd of analysts.)
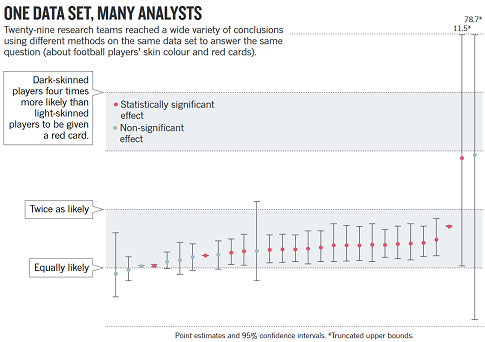
The authors recruited 29 groups of researchers to analyze a single data set concerning soccer penalties and the race of players. The figure at the top of this post shows how the different groups arrived at many different estimates (with different confidences) but about 70% of teams found a significant, positive relationship.
It’s fascinating stuff. The comment is here and the paper by the 29 groups of researchers is here.
OUR FIELD’S MOST RECENT NOBEL LAUREATE THALER AMONG EDITORS

Organizational Behavior and Human Decision Processes (OBHDP) is Announcing a Special Issue on Nudges and Choice Architecture in Organizations
GUEST EDITORS
Katherine L. Milkman, University of Pennsylvania (Managing Guest Editor)
Gretchen Chapman, Rutgers University
David Rand, Yale University
Todd Rogers, Harvard University
Richard H. Thaler, University of Chicago
WHY IS THIS SPECIAL ISSUE IMPORTANT?
The 2008 publication of the best-selling book Nudge: Improving Decisions about Health, Wealth and Happiness by Richard Thaler and Cass Sunstein sparked enormous interest in how choice architecture and nudges can be used to improve outcomes in organizations. Policymakers inside and outside of government are scrambling to master new nudging strategies to improve the decisions of citizens, employees and customers. At least 51 countries now boast “centrally directed policy initiatives” influenced by behavioral science, or so-called “nudge-units,” and many Fortune 500 companies are opening similar divisions. A recent review article highlighted the extraordinary cost-effectiveness of nudges relative to other levers of influence (e.g., incentives, rules, educational campaigns) that are typically used by policymakers inside and outside of organizations to influence behavior (Benartzi et al., 2017). However, in spite of the growing applied interest in using nudging as a policy too!
l, far more field research is needed on what nudges and choice architecture strategies work best to change behavior in organizations. This special issue is meant to (a) publish (future) seminal papers testing the efficacy of nudges and choice architecture through field experiments in organizations and (b) substantially accelerate and shape the direction of academic research in this area.
SCOPE OF SPECIAL ISSUE
Appropriate papers should present field experiments (alone or in combination with laboratory experiments) that explore the efficacy of nudging and choice architecture in organizations. By “field experiment”, we mean a study with random assignment of participants to conditions and participants who engaged in the tasks under study in an environment where they naturally undertake these tasks. We are most interested in experiments (a) whose outcomes are measures of actual behavior (rather than self-report), (b) that include participants who are not MTurk workers, undergraduates in a laboratory, or survey panelists from services like Qualtrics and ClearVoice, and (c) that were conducted in real-world organizational settings. We adopt the following definition of a nudge: nudges “aim to change ‘people’s behavior in a predictable way without forbidding any options or significantly changing their economic incentives. To count as a mere nudge, [an]…intervention must be easy and cheap to avoid. Nudges are not mandates’ (Thaler & Sunstein, 2008). Nudges do not impose material costs but instead alter the underlying ‘choice architecture,’ for example by changing the default option to take advantage of people’s tendency to accept defaults passively. Nudges stand in contrast to traditional policy tools, which change behavior with mandates or bans or through economic incentives (including significant subsidies or fines).” (Benartzi et al., 2017)
We particularly seek manuscripts that have several of the following features: introduce new tools of choice architecture, shed light on important ongoing debates in the literature, yield important new empirical or theoretical insights about previously-studied nudges, are of policy importance, or open up promising directions for future research.
An illustrative, but not exhaustive list of topics that fall within the scope of this special issue is provided below:
1. Field validation and testing of nudges or choice architecture techniques in organizations that have previously only been tested in the laboratory or in limited field contexts.
2. Field validation and testing of novel, untested nudges or choice architecture techniques in organizations.
3. Comparisons of effect sizes or cost effectiveness of multiple nudges and/or economic levers related to managerially relevant outcomes.
4. Field results that shed light on novel mechanisms underlying nudges or choice architecture
To learn more or submit a manuscript, visit http://tinyurl.com/obhdp-nudge

