JDM IS TOO LEGIT TO CEASE IN ITS REPLICABILITY

The R-Index blog was created by Ulrich Schimmack and aims to increase the replicability of published results in psychological science. Recently, the blog created rankings of 104 psychology journals in terms of replicability and published preliminary results. More detail can be found here.
We were pleased to see that the journal Judgment and Decision Making landed in the top 10 of these 104 journals where replicability is concerned.
Jon Baron does a great job with the journal. In other news, we previously reported that Judgment and Decision Making also leads in open data.
STREAK RESULTS FOR LIKELY (>50%) and HIGHLY LIKELY (>99%)
Click to enlarge
From research on the hot hand to the observation that people don’t create enough streaks when instructed to create pseudo random data, the decision science community is pretty interested in the perception of streaks.
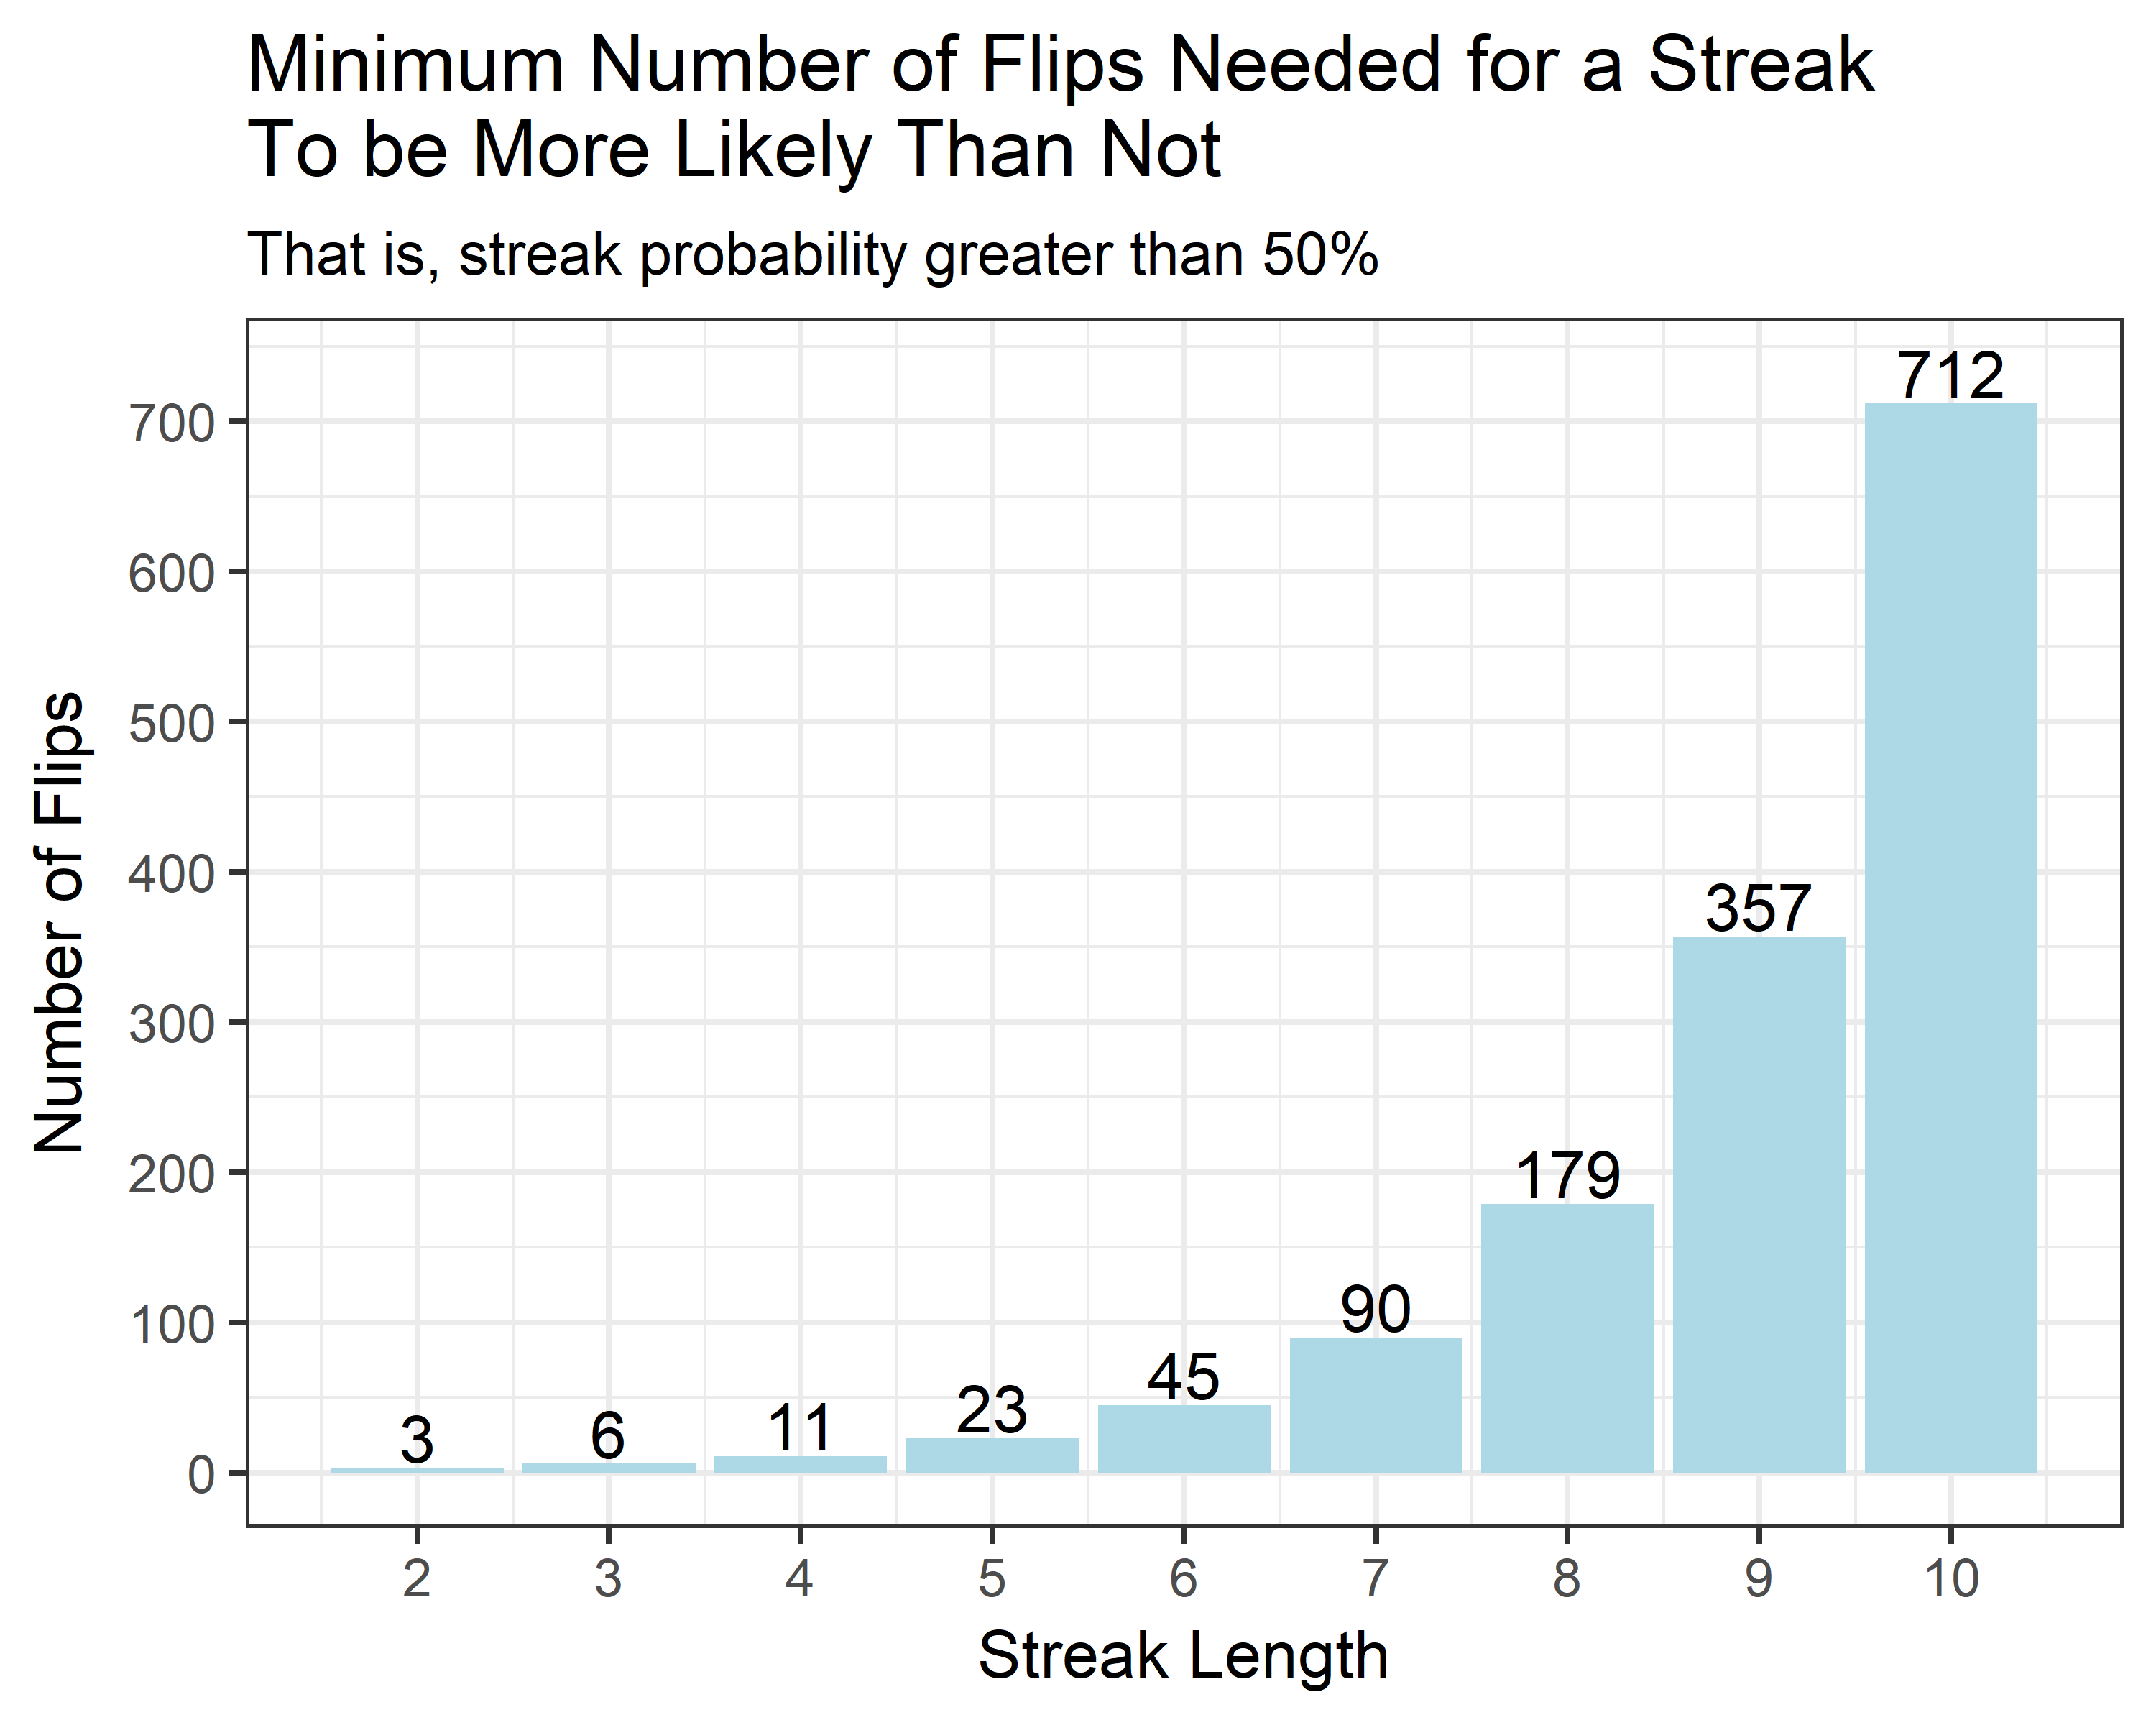
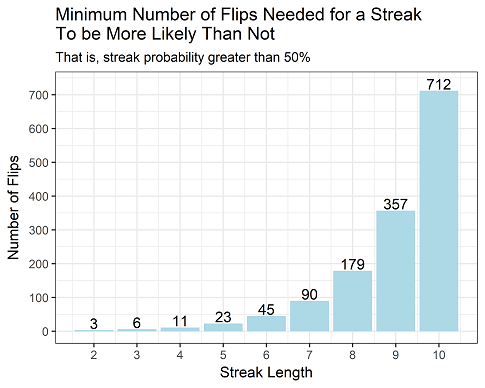
One day we got to wonder, how long would you have to flip a coin for it to be more likely than not you would see a streak of length 10? And in this thought experiment, we mean a fair coin and that the streak could be one of heads or one of tails, and finally that more likely than not means greater than 50% likely.
We found a nice Markov chain solution to the problem and figured out the answer for streaks from length 2 to 16. The above graph has the first 10. The answer is that you need to flip 712 times to exceed a 50% chance of observing a streak of length 10.
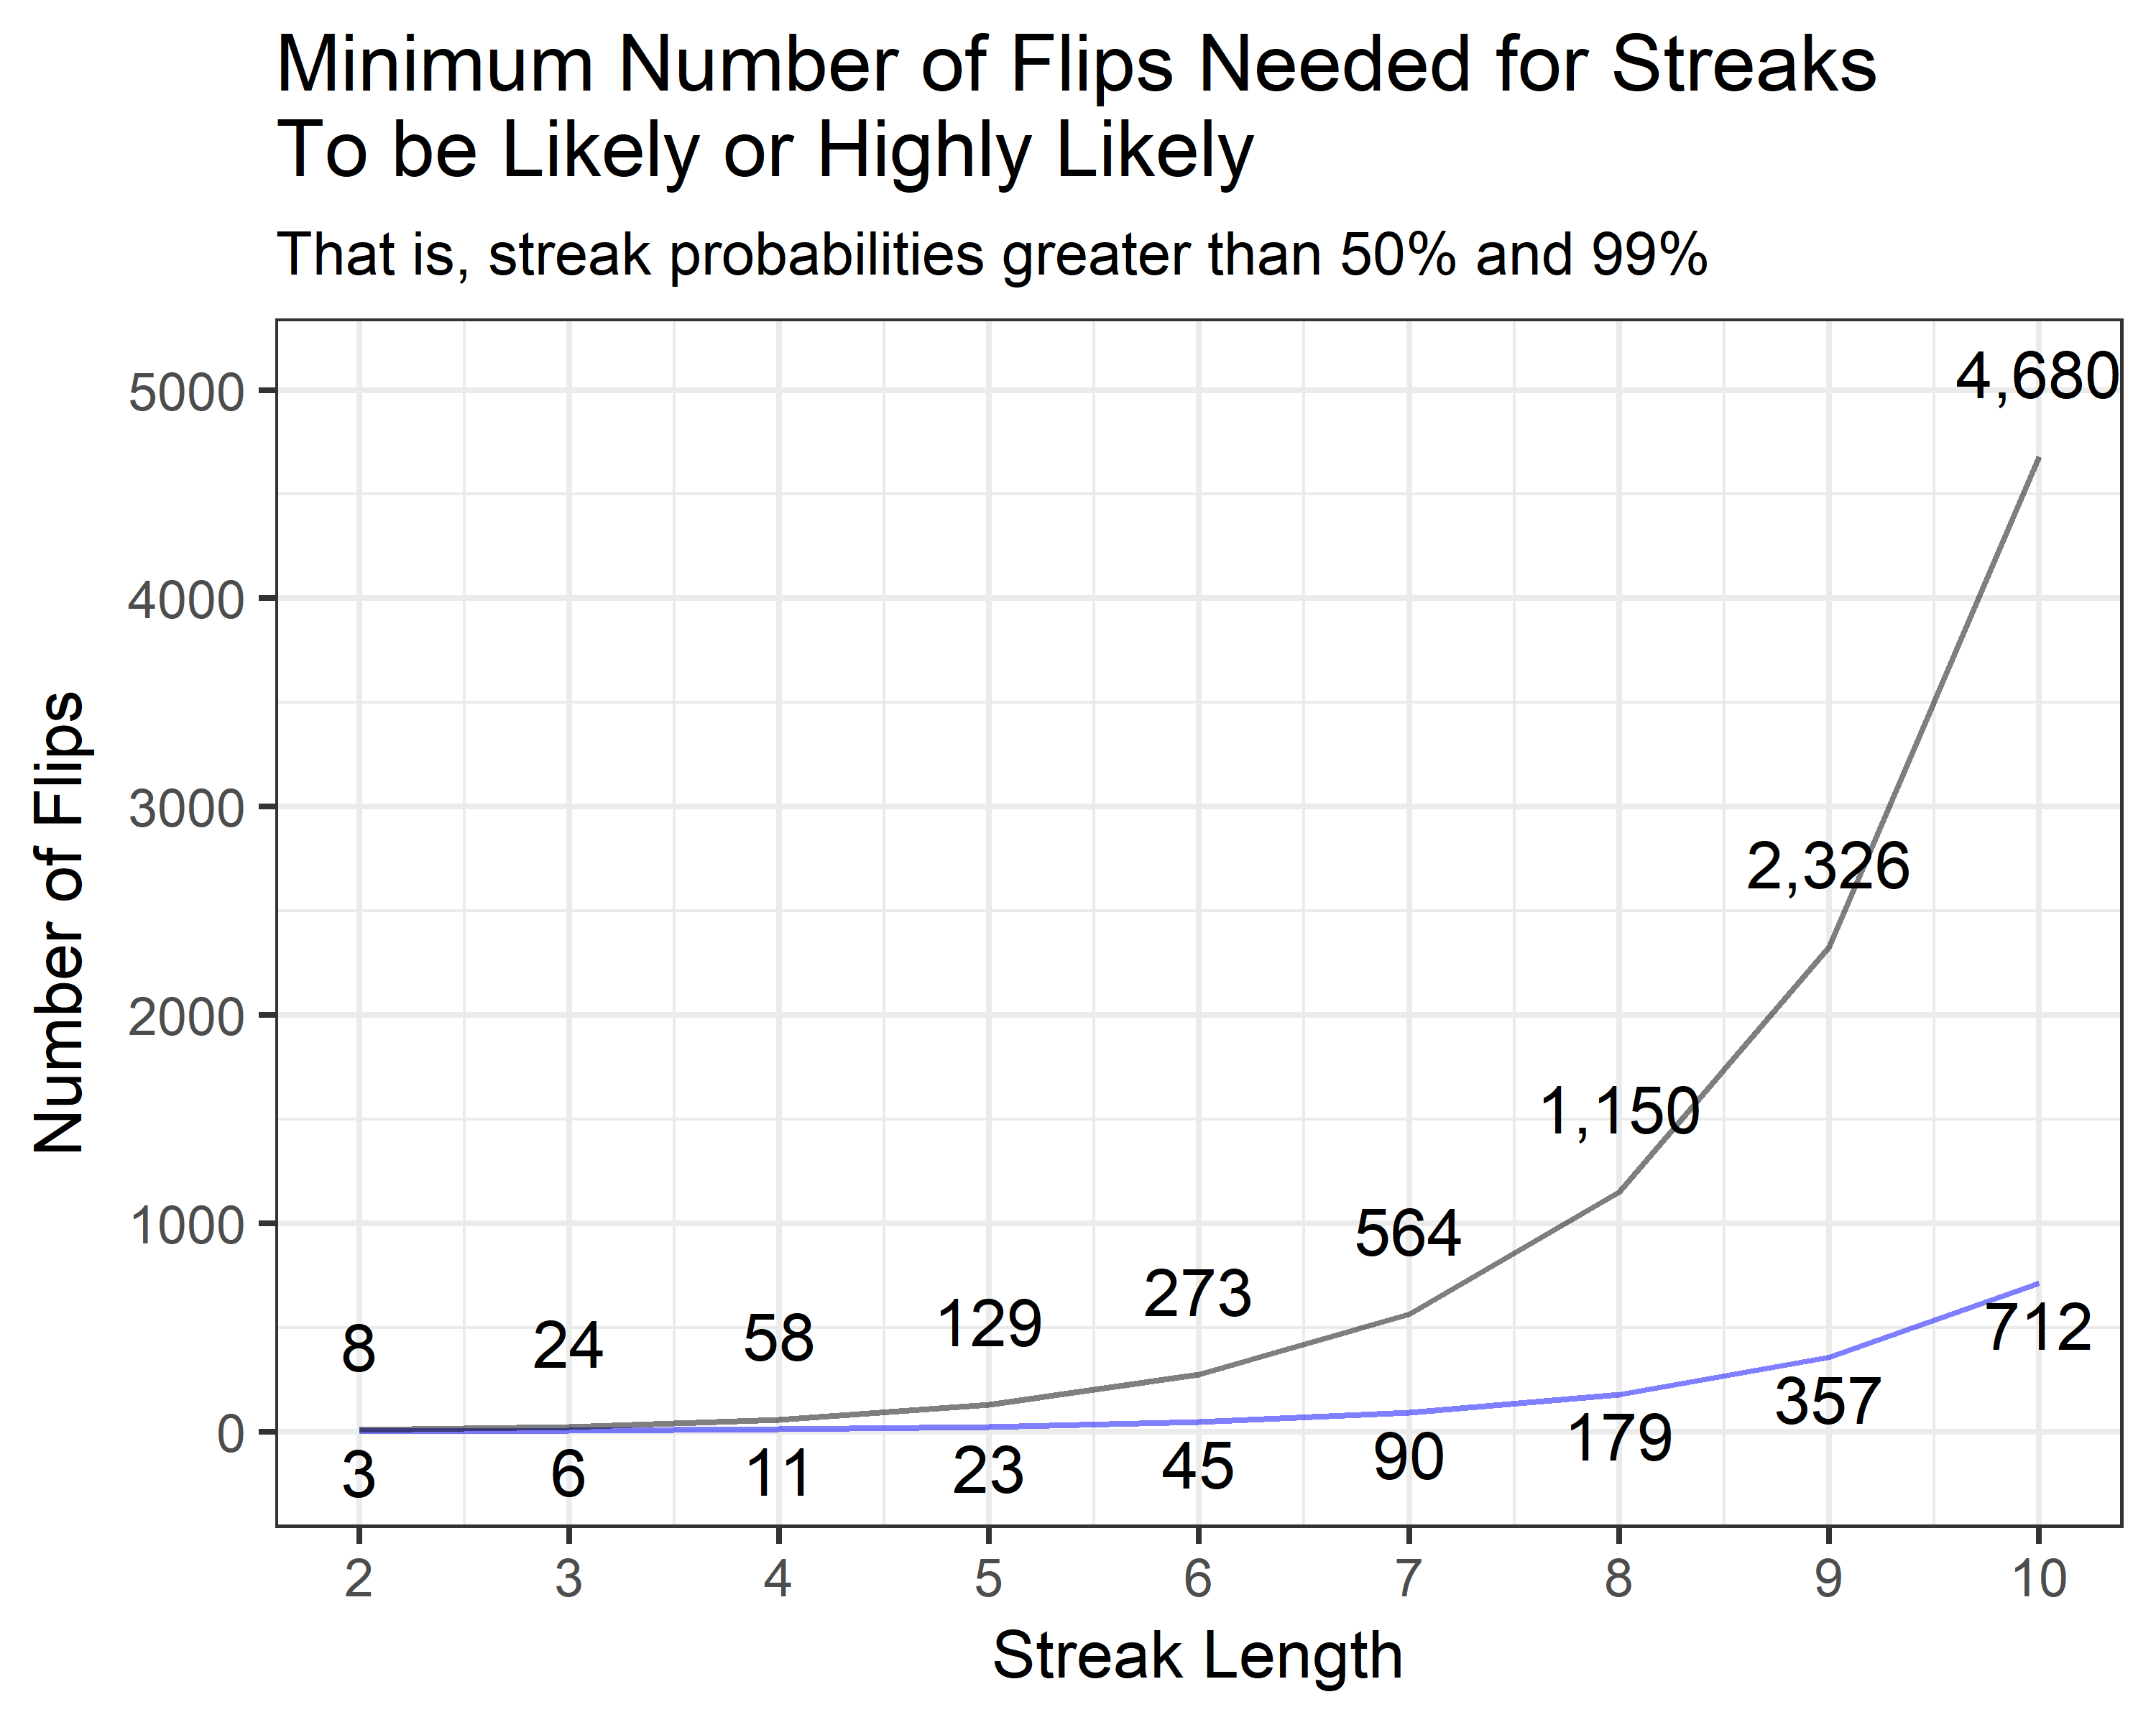
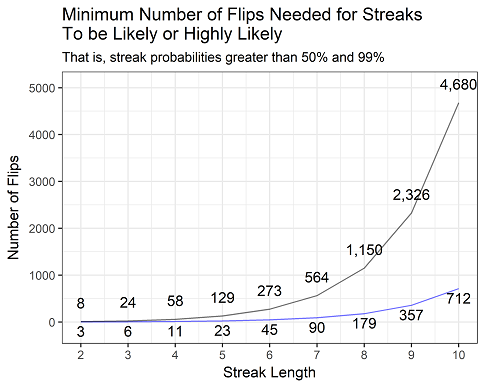
Next we wanted to see how the number of flips would grow if we wanted to be highly likely of seeing a streak, where highly likely means greater than 99%.
Click to enlarge
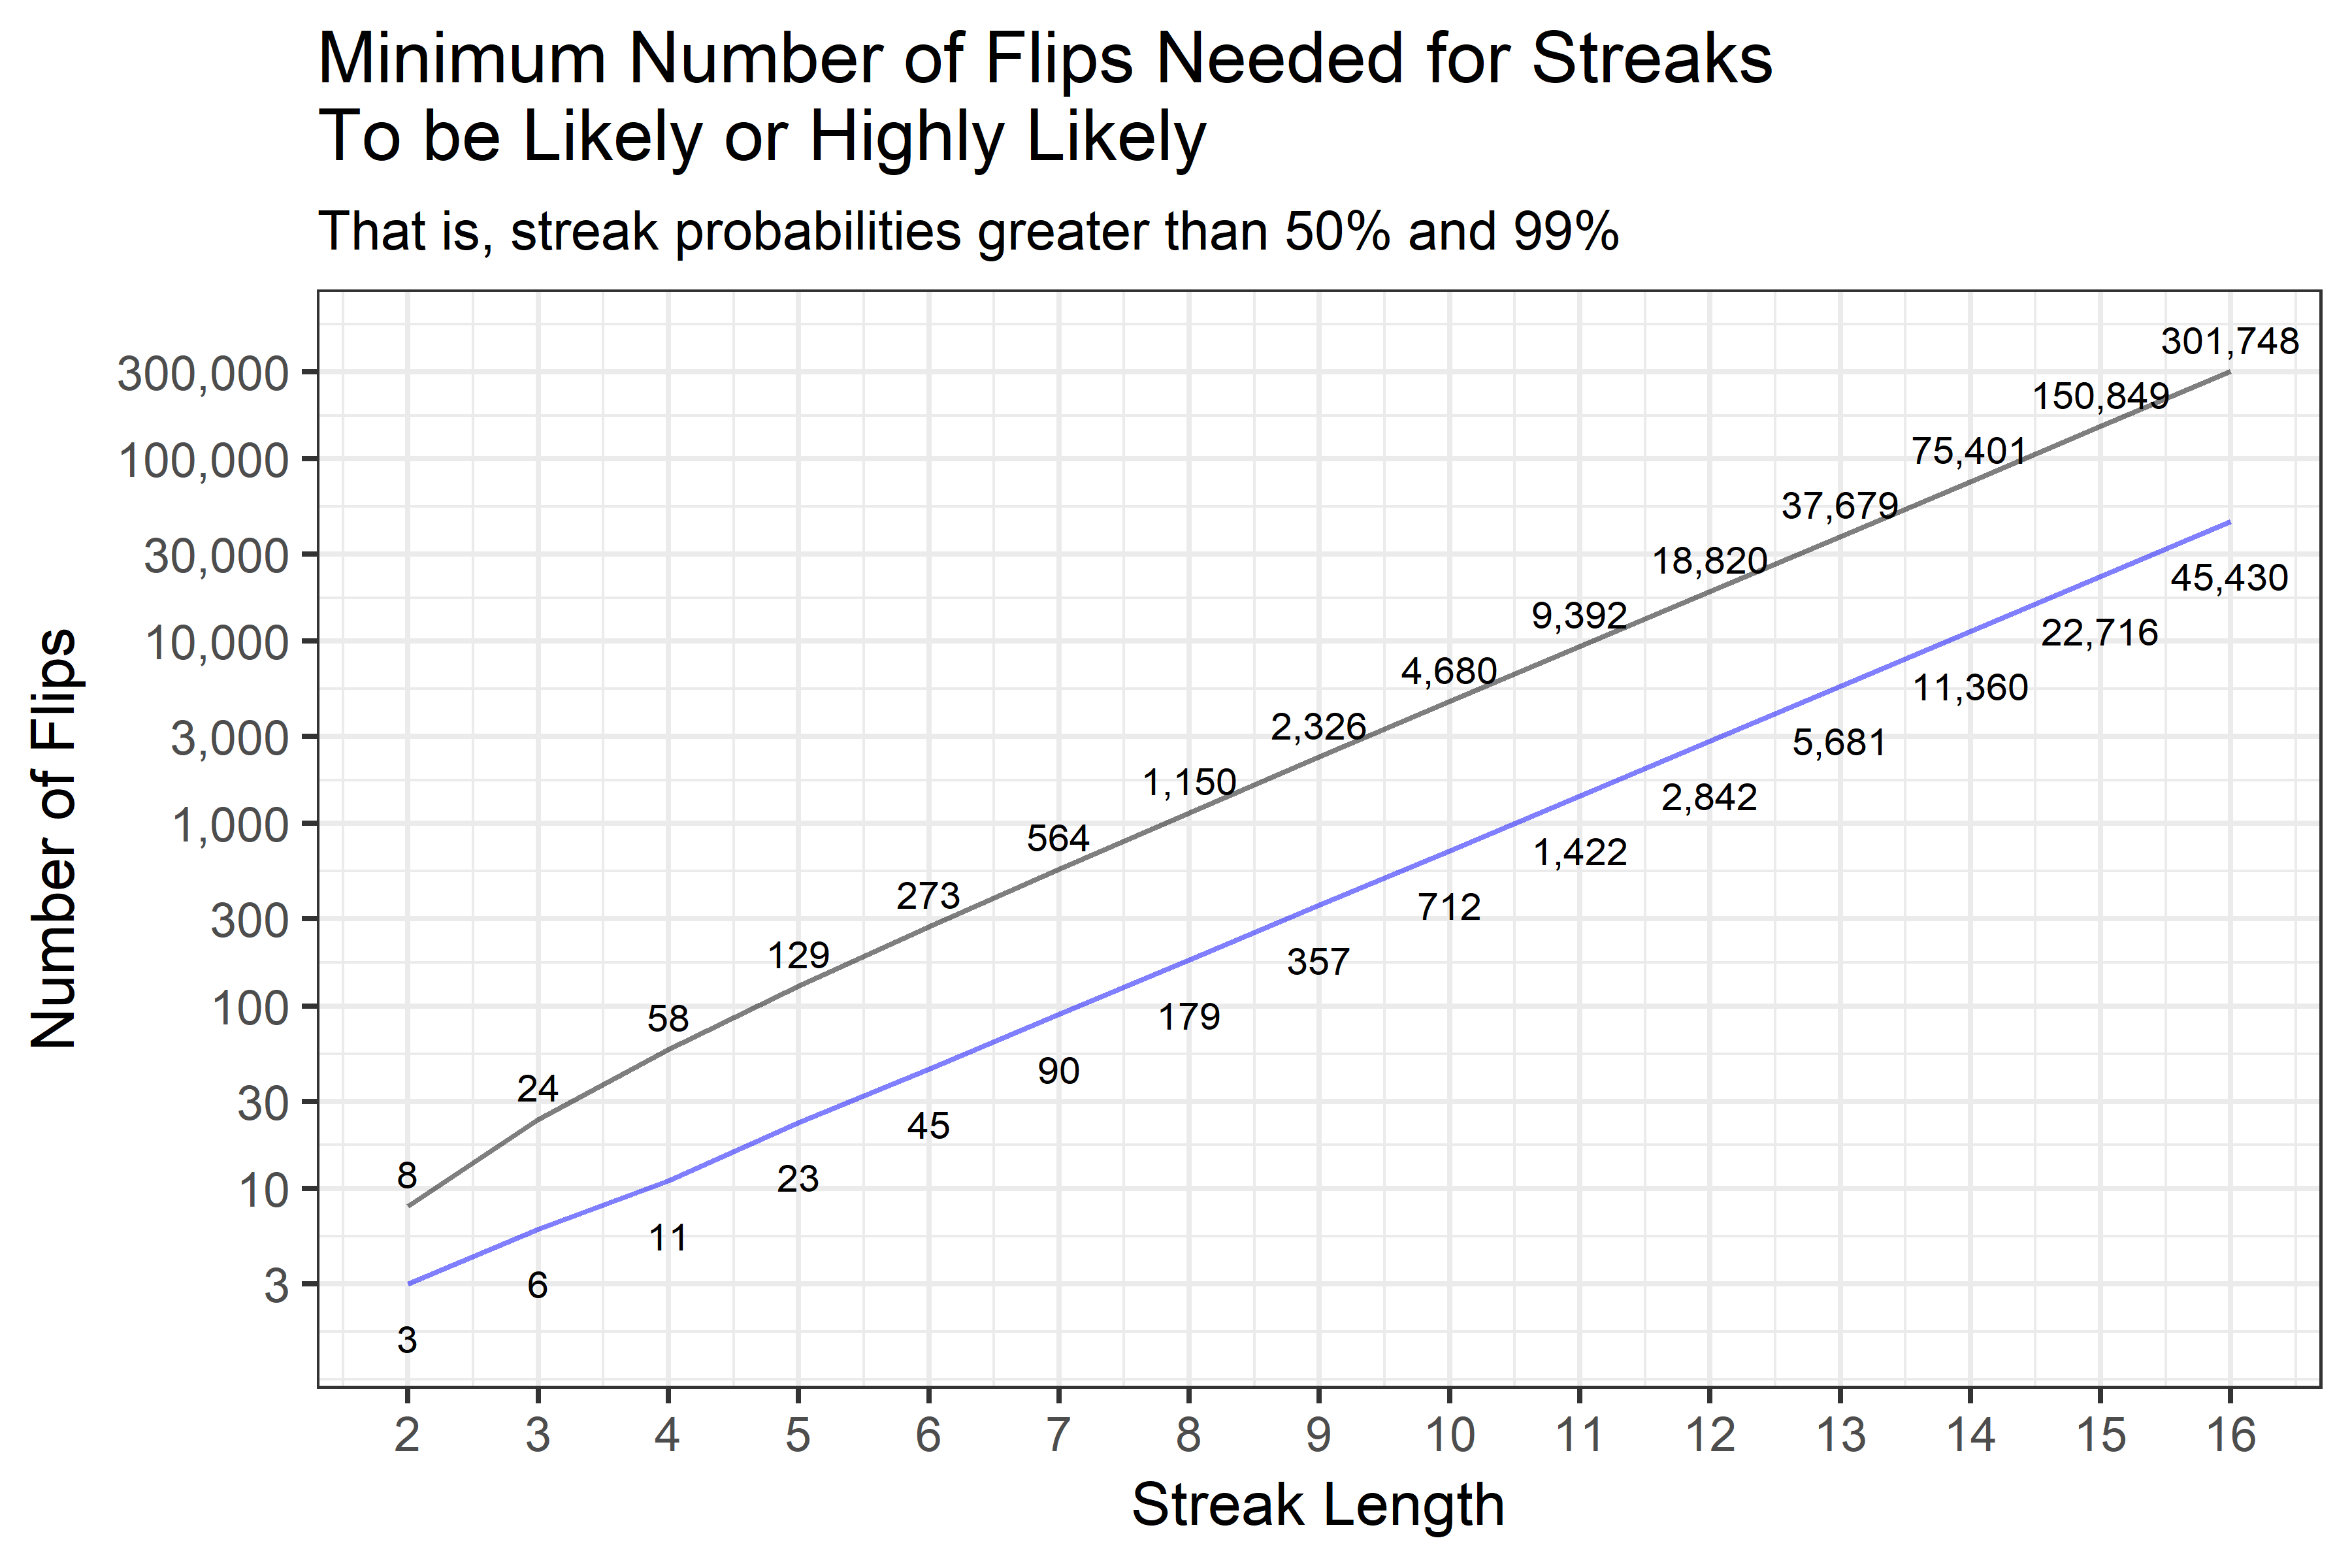
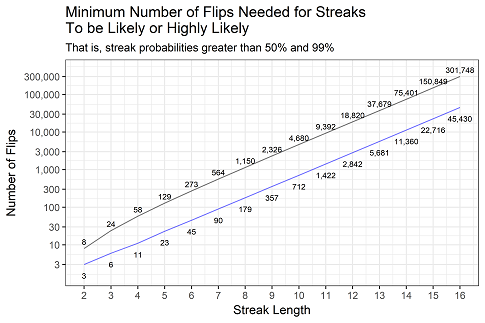
Lastly, we took the results out to 16 flips and plotted the result on a log axis.
Click to enlarge
Here’s R code to mess around with. The Markov chain but could be sped up a lot by starting the search closer to the likely crossover point.
COMPELLING WRITING
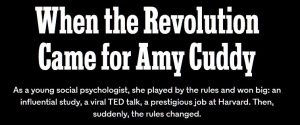
The New York Times just came out with an article called “When the Revolution Came for Amy Cuddy” which is about the science behind an extremely popular TED Talk, and is also about the replication crisis more generally.
As Decision Science News readers, we are confident you will find much to agree within it and much to disagree within it.
You may know many of the people interviewed.
You will probably be talking about it at the upcoming Society for Judgment and Decision-Making conference.
It is compelling writing. Compelling as all get out. We could not put it down.
ADDENDUM
Andrew Gelman has written a reply
There is a lot of debate going on about this article over on this facebook group.
AFTER KAHNEMAN IN 2002, THE SECOND “BEHAVIORAL ECONOMICS” NOBEL GOES TO THALER
The Sveriges Riksbank Prize in Economic Sciences in Memory of Alfred Nobel 2017 has been awarded to Behavioral Economist Richard Thaler of the University of Chicago Booth School of Business “for his contributions to behavioural economics“.
Dr. Thaler was born in 1945 and Received his Ph.D. in 1974 from the University of Rochester, New York. He is a Charles R. Walgreen Distinguished Service Professor of Behavioral Science and Economics at the University of Chicago Booth School of Business, Illinois.
The amount of the prize is 9 million Swedish krona or 1,108,825 US dollars at the current exchange rate. Thaler says “I will try to spend it as irrationally as possible!”
Being behavioral economists, we at Decision Science News know a lot about Richard Thaler. As a reader of Decision Science News, you probably know a lot about Richard Thaler as well. If you don’t there are some useful links below. One thing we didn’t know, until we read the press release, is that he was born in East Orange, New Jersey, which is really close to New York City. See for yourself.

REFERENCES
Scientific Background: Richard H. Thaler: Integrating Economics with Psychology (NobelPrize.org) – 37 page paper on Thaler’s contributions to behavioral economics.
Nobel in Economics Is Awarded to Richard Thaler (NY Times) – Announcement
Nobel Prize awarded to Richard Thaler (Marginal Revolution) – Provides a good overview of Thaler’s academic ideas
Nudge: Improving Decisions about Health, Wealth, and Happiness (With Cass Sunstein) – Thaler’s most popular book
Misbehaving: The Making of Behavioral Economics – Retrospective
GUEST POST BY SID SURI: MONTH LONG PRISONER’S DILEMMA
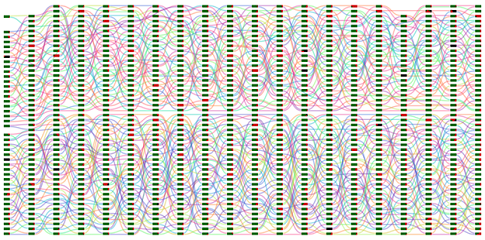
Figure 1: All the games and random rematchings in one out of the twenty sessions we conducted. Each block of green/red shows a game where green represents cooperation and red represents defect. Curves between the games represent how players were randomly rematched.
DSN readers, you are in for a treat this week as Sid Suri, our many-time co-author and colleague at Microsoft Research, is writing a guest post on his repeated prisoner’s dilemma experiment. Many of you heard this experiment summarized in the 2016 Society for Judgment and Decision Making Presidential Address.
Long-run prisoner’s dilemma, a guest post by Sid Suri
Cooperation and more specifically, the Prisoner’s Dilemma, is one of the most studied topics in social science. Yet, despite over 50 years of research and thousands of studies, we still don’t have a good understanding of how people play PD in the long run. The standard theory predicts that, in a finitely repeated game, rational players will use backwards induction to converge on the Nash equilibrium of always defecting. That is, players will cooperate until the last round and defect, and then cooperate until the second to last round and defect and so on until cooperation “unravels” and everyone is defecting on every round. Experimentalists have tried to test this theory by conducting lab experiments where subjects play PD for a few hours. While they might find a little unraveling, these experiments are generally much too short in duration to see how far it goes.
To address this gap in the literature, Andrew Mao, Lili Dworkin, Duncan Watts and I [Sid Suri] conducted an experiment where approximately 100 players each played about 400 ten-round games of PD resulting in almost 400,000 cooperate or defect decisions overall. Subjects were randomly rematched between games and the games were conducted in one-hour sessions, every weekday for a month. (See Figure 1 for a representation of one session.) As these numbers suggest, conducting this experiment online, using a “virtual lab” environment allowed us to skirt some of the logistical limitations of prior lab studies.
Our results showed that cooperation unraveled for the first week and then cooperation levels stabilized after that at above 80%. Furthermore, the reason for this stabilization was due to the roughly 40% of our subject pool who behaved as “resilient cooperators”. These subjects would cooperate until someone else defected on them, and importantly, would not defect on others first, even if they got defected on in a previous game. These resilient cooperators effectively propped up the cooperation levels of the population (see Figure 2). It took us one week of experimentation to just get to the point where cooperation levels stabilized so these findings would have been extremely difficult to see in a lab experiment. We also showed, this time through simulation, that were it not for a sufficient fraction of resilient cooperators, cooperation levels would have unraveled.

Figure 2: Cooperation levels were high and sustained resulting in players earning 84% of the maximum social welfare.
Many prior studies have suggested mechanisms for boosting and sustaining cooperation like punishment, reward, ostracism, and partner selection. Our results suggest that these mechanisms may not be necessary and that a closed population can sustain cooperation on their own provided they have a sufficient fraction of resilient cooperators among them.
REFERENCE
Link to article
Mao, A., Dworkin, L., Suri, S., & Watts, D. J. (2017). Resilient cooperators stabilize long-run cooperation in the finitely repeated Prisoner’s Dilemma. Nature communications, 8, 13800.
COMPUTATIONAL APPROACHES TO MEMORY AND DECISION MAKING — PSYCHONOMICS PRE-CONFERENCE

A symposium organized by the Society for Mathematical Psychology
Hosts: Clintin Davis-Stober, Pernille Hemmer
Thursday, November 9, 2017
The Society for Mathematical Psychology promotes the advancement and communication of research in mathematical psychology and related disciplines.
Mathematical psychology is broadly defined to include work of a theoretical character that uses mathematical methods, formal logic, or computer simulation.
Decision Science News loves mathematical psychology.
The topic of this year’s symposium is “Computational Approaches to Memory and Decision Making”
The invited speakers will be presenting their work on this theme from a variety of quantitative modeling perspectives.
This symposium will also feature a poster session. You can submit abstracts for posters here.
If you are planning to attend, please register! You can do so here.
You can view the symposium schedule here.
As of Sept 22, 2017 it is as:
Thursday, November 9th
08:55 Opening Remarks
09:00 – 10:20 Session I: Computational Brain & Behavior
10:20 Break
10:35 – 11:55 Session II: Modeling Episodic Memory
10:35 Mark Steyvers University of California, Irvine
10:55 Chris R. Sims Rensselaer Polytechnic Institute
11:15 Amy Criss Syracuse University
11:35 Candice Morey University of Edinburgh
11:55 Lunch
13:00 – 14:15 Poster Session
14:15 – 15:35 Session III: Modeling Decision Making
14:15 Sudeep Bahtia University of Pennsylvania
14:35 Timothy J. Pleskac Max Planck Institute for Human Development
14:55 David Kellen Syracuse University
15:15 Clintin P. Davis-Stober University of Missouri
SJDM VANCOUVER DISCOUNTED REGISTRATION RATE BEFORE OCT 30, 2017

JDM not only the best conference of its kind but also the best value.
The early registration fee is $300 for members, $350 for non-members, and $150 for student members. (The late registration fee, after October 30, is $350 for members, $400 for non-members, and $200 for student members.)
For more information, and forms for payment, see http://www.sjdm.org, and follow the link to “Join, pay dues, register, donate”. Or just go to http://www.sjdm.org/join.html.
Filed in
Conferences
 Subscribe
 to Decision Science News by Email (one email per week, easy unsubscribe)
SUBMISSION DEADLINE FOR POSTERS DECEMBER 1, 2017

The 13th annual Judgment and Decision Making Pre-Conference at the Society for Personality and Social Psychology annual meeting will be held from 8:30am to 4:30 pm on March 1st, 2018 in Atlanta. The pre-conference highlights the emerging nexus of social, personality, judgment, and decision making research.
Our scheduled speakers include:
- Steven Sloman, Brown University
- Heather Schofield, University of Pennsylvania
- Cynthia Cryder, Washington University in St. Louis
- Todd Rogers, Harvard University
- Jason Dana, Yale University
- Brigitte Madrian, Harvard University
- Jeff Galak, Carnegie Mellon University
The pre-conference will also feature a poster session, and we will offer a limited number of $200 travel reimbursements to undergraduate or graduate students who are first authors on accepted posters. Selected travel award winners will also be given the opportunity to present a 10-minute “data blitz” talk during the pre-conference. The deadline for poster submissions is December 1st, 2017.
To register for the conference, or for more information, please visit the pre-conference website at:
http://meeting.spsp.org/preconferences/judgment
Hope to see you all in Atlanta.
Organizers:
Alex Imas, Mary Steffel, and David Tannenbaum
SJDM LAUNCHES THE NEW IT’S YOUR CHOICE BLOG
The Society for Judgment and Decision Making (JDM Society) has gone a long time without a web log. They have a journal, a newsletter, and a fine conference, but until recently no blog to call their own.
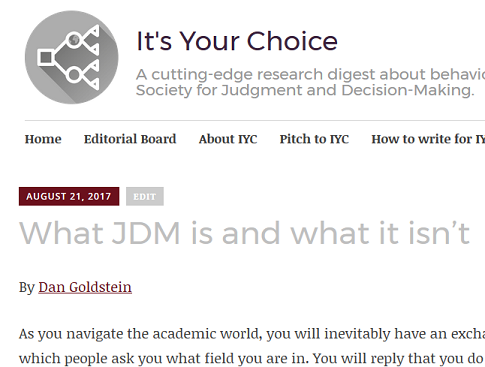
That changes now with the launch of It’s Your Choice, edited by Laura Scherer and Gaëlle Vallée-Tourangeau. The tagline is “a cutting edge research digest about behavioral decision science from the Society for Judgment and Decision Making”.
The kick-off post is here. In it, Laura and Gaëlle say that will mainly be publishing 800-1000 word research briefs contributed submitted by authors like you (Decision Science News Readers), in addition to these other kinds of posts:
- methodology posts discussing important issues relevant to conducting of JDM research or introducing new methodological procedures for studying JDM.
- explainers which aim to provide the background knowledge necessary to understand current topical JDM research
- opinion columns where authors are free to express their views on hot topics relevant to JDM
- reflective commentaries describing a practical “real-world” JDM issues
The post kick-off post post is by Dan Goldstein, former SJDM President, on what JDM is and what it isn’t.
Submit your own content to It’s Your Choice.
PUTTING 35 INCHES OF RAIN IN PERSPECTIVE
We are always interested in putting numbers into perspective, so we were interested in this article in which they put the Hurricane Harvey’s rain into perspective.
They’re predicting 30-40 inches of rain in a few days in Texas. They asked an expert to put that into perspective and he said:
Let’s put it in context. Much of the Northeast Corridor — Washington to New York and Boston — maybe receives maybe between 40 and 45 inches of rain a year. Think of all the rain you get in July through Christmas and put that in a couple days. It’s a lot of rain.
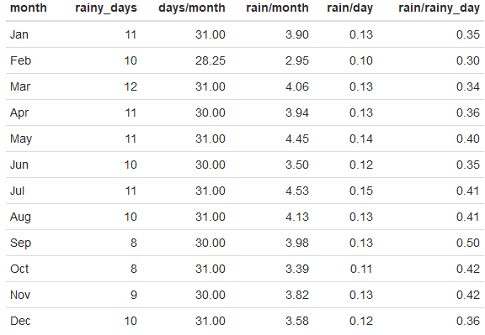
It’s easy for us to think in terms of New York City, so we looked up some weather data. See the table at the top of this post (all figures are in inches).
First thing we can notice is that the expert understated things, for New York at least. Thirty five inches would be equivalent to all the rain in NYC from April (not July) to December, inclusive.
But we agree that it’s a lot of rain.
We’ve always had trouble putting rain forecasts into perspective, so here are some rules of thumb we figured out from the data that we’re going to memorize. If you live in the corridor from DC to Boston, you may find these useful.
- The average amount of rain per rainy day in NYC is .38 inches, which conveniently is about 1 cm.
- When you hear it’s going to rain 1 cm or 3/8 inch, you can think “no big deal, that’s a typical NYC rainy day”.
- If you hear it’s going to rain an inch, you can think “oh darn, that’s like three rainy days worth”.
Here’s R-markdown code if you want to play around: