Filed in
Conferences
 Subscribe
 to Decision Science News by Email (one email per week, easy unsubscribe)
THE DAY BEFORE THE MARKETING SCIENCE / FTC CONFERENCE ON CONSUMER PROTECTION
View this announcement online
Decision Science News will be in the house!
The Federal Trade Commission will host a public workshop in Washington, DC on September 15, 2016 to examine the testing and evaluation of disclosures that companies make to consumers about advertising claims, privacy practices, and other information.
Effective disclosures are critical in helping consumers make informed decisions in the marketplace.
Many advertisers have used disclosures in an attempt to prevent their advertisements from being deceptive. Disclosures must be crafted with care both with respect to their language and presentation. Disclosures used in the marketplace are sometimes ineffective. Commission staff has recommended that disclosures be tested for effectiveness.
Disclosures are also challenging in the privacy arena, whether disclosing to consumers that their physical location or online interactions are being tracked, or explaining privacy practices when consumers sign up for a service. Privacy policies are often long and difficult to comprehend and privacy-related icons may fail to communicate information meaningfully to consumers. Furthermore, the accompanying mechanisms for consumers to provide informed consent or exercise choices about the use of their data may also be confusing. The Commission has long encouraged the development and testing of shorter, clearer, easier-to-use privacy disclosures and consent mechanisms.
The FTC has issued guides to help businesses avoid deceptive claims, such as guidance related to endorsements, environmental claims, fuel economy advertising, and the jewelry industry. Often the guidance presents options for qualifying claims to avoid deception. In developing guides, the Commission has sometimes relied on consumer research to gauge whether specific disclosures can be used to qualify otherwise misleading claims.
The FTC has a long commitment to understanding and testing the effectiveness of consumer disclosure, and is especially interested in learning about the costs and benefits of disclosure testing methods in the digital age. A number of factors impact the effectiveness of disclosures, including whether they contain the most essential information and consumers notice them, direct their attention towards them, comprehend them, and are able to use that information in their decision making. Some testing methods are more appropriate than others for evaluating these factors.
The workshop is aimed at encouraging and improving the evaluation and testing of disclosures by industry, academics, and the FTC. The FTC’s workshop will explore how to test the effectiveness of these disclosures to ensure consumers notice them, understand them and can use them in their decision-making. It is intended to further the understanding of testing and evaluation of both offline and online consumer disclosures, including those delivered through icons, product labels, short text, long text, audio or video messages, interactive tools, and other media. Topics may include evaluation criteria, testing methodologies and best practices, case studies, and lessons learned from such testing.
No registration is necessary to attend. The workshop will be webcast and a link will be available here on the day of the event.
An agenda is online.
Filed in
Programs
Subscribe to Decision Science News by Email (one email per week, easy unsubscribe)
APPLICATION DEADLINE 25 SEPTEMBER 2016

The T A Pai Management Institute (TAPMI) in collaboration with the Max Planck Institute for Human Development (MPIB) is excited to announce the Winter School on Bounded Rationality at TAPMI, Manipal (Karnataka), India to be held from January 09–15, 2017. The winter school aims to foster understanding the process and quality of human decisions and to apply this knowledge to the real world, enabling people to make better decisions in a complex world. To this end, it offers a unique forum for decision-making scholars and researchers from various disciplines to share their approaches, discuss their research and applications, and inspire each other.
KEYNOTE ADDRESS
Gerd Gigerenzer
Director of the Center for Adaptive Behavior and Cognition and the Harding Center for Risk Literacy, Max Planck Institute for Human Development, Germany.
TOPICS
The winter school shall focus on diverse set of topics:
- Bounded Rationality, Ecological Rationality, Social Rationality
- Behavioral Economics and Finance
- Heuristics
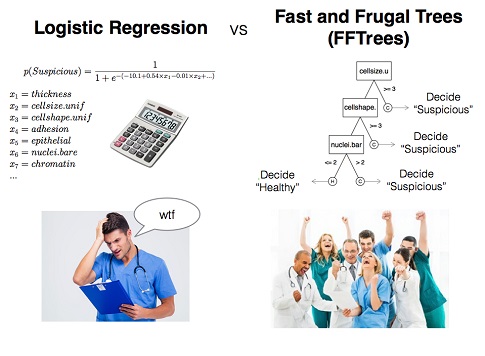
- Fast and Frugal Trees
- Risk and Risk Literacy
- Medical Decision Making
Seminars, talks, panel discussions, workshops, poster sessions, and social events will take
place, allowing participants to learn and develop new ideas in broad areas of Judgment and
Decision Making, facilitated by frequent interactions with the teaching faculty members.
APPLICATION
Deadline for Application is September 25 2016. Participation will be free, accommodation will be provided, and travel expenses will be partly reimbursed. Winter School web link (includes contact details and application procedure):
For further questions email us at winterschool@tapmi.edu.in We look forward to seeing you at Manipal!
Filed in
Conferences
Subscribe to Decision Science News by Email (one email per week, easy unsubscribe)
ECONOMIC CONFERENCE ON MARKETING AND CONSUMER PROTECTION

View this announcement online
The Federal Trade Commission’s Bureau of Economics and Marketing Science are co-organizing a one-day conference to bring together scholars interested in issues at the intersection of marketing and consumer protection policy and regulation. As the primary consumer protection law enforcement agency, the FTC has benefited from the marketing literature in its long history of case and policy work. The goal of the conference is to promote an intellectual dialogue between marketing scholars and FTC economists. Specifically, the conference will serve as a vehicle for marketing scholars to learn about the FTC’s practice in consumer protection, promoting potentially high impact research in the area of consumer protection and regulation, and introducing FTC economists to some of the cutting-edge research being conducted by marketing scholars. The conference will feature academic research paper sessions and a panel discussion between FTC economists and marketing scholars.
CONFERENCE PROGRAM
The conference program will run from 8:30 am to 5:30 pm on Friday, September 16, 2016, in the FTC 5th Floor Conference Room at Constitution Center. There will be an optional dinner after the conference starting at 6:00 pm. A fee of $100 will apply to participants who choose to attend the dinner.
Pre-registration for this conference is necessary. To pre-register, please e-mail your name, affiliation, and whether you intend to participate in the conference dinner to marketingconf@ftc.gov (link sends e-mail). Attendees must register for the conference dinner by September 1. Your email address will only be used to disseminate information about the conference. If space permits, we may allow a very limited number of onsite registrations beginning at 8:15 am on September 16.
The scientific committee for this conference consists of:
K. Sudhir, Editor-in-Chief, Marketing Science and Professor of Marketing, Yale School of Management
Avi Goldfarb, Senior Editor, Marketing Science and Professor of Marketing, University of Toronto
Ganesh Iyer, Senior Editor, Marketing Science and Professor of Marketing, University of California, Berkeley
Ginger Jin, Director, Federal Trade Commission Bureau of Economics and Professor of Economics, University of Maryland
Andrew Stivers, Deputy Director, Federal Trade Commission Bureau of Economics
SPONSORS
INFORMS Society of Marketing Science (ISMS)
Federal Trade Commission Bureau of Economics
STAFF CONTACT
Constance Herasingh
202-326-2147
marketingconf@ftc.gov
Those interested in the Marketing Science – Federal Trade Commission Economic Conference on Marketing and Consumer Protection may also be interested in the FTC Workshop: Putting Disclosures to the Test on September 15, 2016.
Filed in
Jobs
Subscribe to Decision Science News by Email (one email per week, easy unsubscribe)
DEADLINE TO APPLY NOVEMBER 1st, 2016


The Operations, Information and Decisions Department at the Wharton School is home to faculty with a diverse set of interests in behavioral economics, decision-making, information technology, information-based strategy, operations management, and operations research. We are seeking applicants for a full-time, tenure-track faculty position at any level: Assistant, Associate, or Full Professor. Applicants must have a Ph.D. (expected completion by June 2017 is preferred but by June 30, 2018 is acceptable) from an accredited institution and have an outstanding research record or potential in the OID Department’s areas of research. The appointment is expected to begin July 1, 2017.
More information about the Department is available at:
https://oid.wharton.upenn.edu/index.cfm
Interested individuals should complete and submit an online application via our secure website, and must include:
• A curriculum vitae
• A job market paper
• (Applicants for an Assistant Professor position) Three letters of recommendation submitted by references
To apply, please visit this web site:
https://oid.wharton.upenn.edu/faculty/faculty-recruiting/
Further materials, including (additional) papers and letters of recommendation, will be requested as needed.
To ensure full consideration, materials should be received by November 1st, 2016.
Contact:
OID Department
The Wharton School
University of Pennsylvania
3730 Walnut Street
500 Jon M. Huntsman Hall
Philadelphia, PA 19104-6340
The University of Pennsylvania is an affirmative action/equal opportunity employer. All qualified applicants will receive consideration for employment and will not be discriminated against on the basis of race, color, religion, sex, national origin, disability status, protected veteran status, or any other characteristic protected by law.
CLASSIC HEURISTICS AND DATA SETS ALL IN ONE TIDY PACKAGE
It just got a lot easier to simulate the performance of simple heuristics.
Jean Czerlinski Whitmore, a software engineer at Google with a long history in modeling cognition, and Daniel Barkoczi, a postdoctoral fellow at the Max Planck Institute for Human Development, have created heuristica: an R package to model the performance of simple heuristics. It comprises the heuristics covered in the first chapters of Simple Heuristics That Make Us Smart such as Take The Best, Unit Weighted Linear model, and more. The package also includes data, such as the the original German cities data set which has become a benchmark for testing heuristic models of choice, cited in hundreds of papers.
A good place to start is the README vignette, as with vignettes:
Here’s the heuristica package’s home on CRAN and here’s a description of the package in the authors’ own words:
The heuristica R package implements heuristic decision models, such as Take The Best (TTB) and a unit-weighted linear model. The models are designed for two-alternative choice tasks, such as which of two schools has a higher drop-out rate. The package also wraps more well-known models like regression and logistic regression into the two-alternative choice framework so all these models can be assessed side-by-side. It provides functions to measure accuracy, such as an overall percentCorrect and, for advanced users, some confusion matrix functions. These measures can be applied in-sample or out-of-sample.
The goal is to make it easy to explore the range of conditions in which simple heuristics are better than more complex models. Optimizing is not always better!
Filed in
Gossip ,
Ideas
Subscribe to Decision Science News by Email (one email per week, easy unsubscribe)
PUTTING OUR MONEY WHERE OUR MOUTH IS
Click to enlarge
Some experts seem pretty sure Donald Trump will be the next US President. Michael Moore wrote an article entitled 5 Reasons Why Trump Will Win.

Prediction maven Nate Silver has warned a few days ago “Don’t think people are really grasping how plausible it is that Trump could become president. It’s a close election right now.”
Despite this, we think that Hillary Clinton is going to win.
And we’ve put our money where our mouth is. There’s a prediction market called PredictIt in which US citizens in most states can legally bet on events happening or not. There’s an $850 limit on any contract, but you can get around that, in the following way.
As the figure up top shows, we’ve placed two bets:
- We bet $799.50 that the next President will not be a Republican. That is, we bought 1250 shares of “no” on that contract at 65 cents each. If the next President is indeed not a Republican, we’ll be able to sell those shares for a dollar each, or $1230. Otherwise we lose our money.
- We bet $849.87 that Hillary Clinton will be the next President. That is, we bought 1349 shares of “yes” on that contract at 63 cents. If Hillary wins, we’ll be able to sell our shares for $1349. Otherwise we lose our money.
So, we’ve bet $1,649.37. If Hillary wins, we’ll have $2,579 (minus the market’s 10% fee on profits). If Trump or some other Republican wins, we’ll have bupkis.
Filed in
Conferences
Subscribe to Decision Science News by Email (one email per week, easy unsubscribe)
CALL FOR PAPERS. SUBMISSION DEADLINE AUG 26, 2016

This winter, the Consumer Financial Protection Bureau (CFPB) will host its second research conference on consumer finance.
We encourage the submission of a variety of research. This includes, but is not limited to, work on: the ways consumers and households make decisions about borrowing, saving, and financial risk-taking; how various forms of credit (mortgage, student loans, credit cards, installment loans etc.) affect household well-being; the structure and functioning of consumer financial markets; distinct and underserved populations; and relevant innovations in modeling or data. A particular area of interest for the CFPB is the dynamics of households’ balance sheets.
A deliberate aim of the conference is to connect the core community of consumer finance researchers and policymakers with the best research being conducted across the wide range of disciplines and approaches that can inform the topic. Disciplines from which we hope to receive submissions include, but are not limited to, economics, the behavioral sciences, cognitive science, and psychology.
The conference’s scientific committee includes:
- Adair Morse (University of California Berkeley, Haas School of Business)
- Annette Vissing-Jorgensen (University of California Berkeley, Haas School of Business)
- Colin Camerer (California Institute of Technology)
- Eric Johnson (Columbia University, Columbia Business School)
- Jonathan Levin (Stanford University)
- Jonathan Parker (Massachusetts Institute of Technology, Sloan School of Management)
- José-Victor Rios-Rull (University of Pennsylvania)
- Judy Chevalier (Yale School of Management)
- Matthew Rabin (Harvard University)
- Susan Dynarski (University of Michigan)
Authors may submit complete papers or detailed abstracts that include preliminary results. All submissions should be made in electronic PDF format to CFPB ResearchConference at cfpb.gov by Friday, August 26th, 2016.
Please remember to include contact information on the cover page for the corresponding author. Please submit questions or concerns to Worthy.Cho at cfpb.gov.
Filed in
Ideas ,
R
Subscribe to Decision Science News by Email (one email per week, easy unsubscribe)
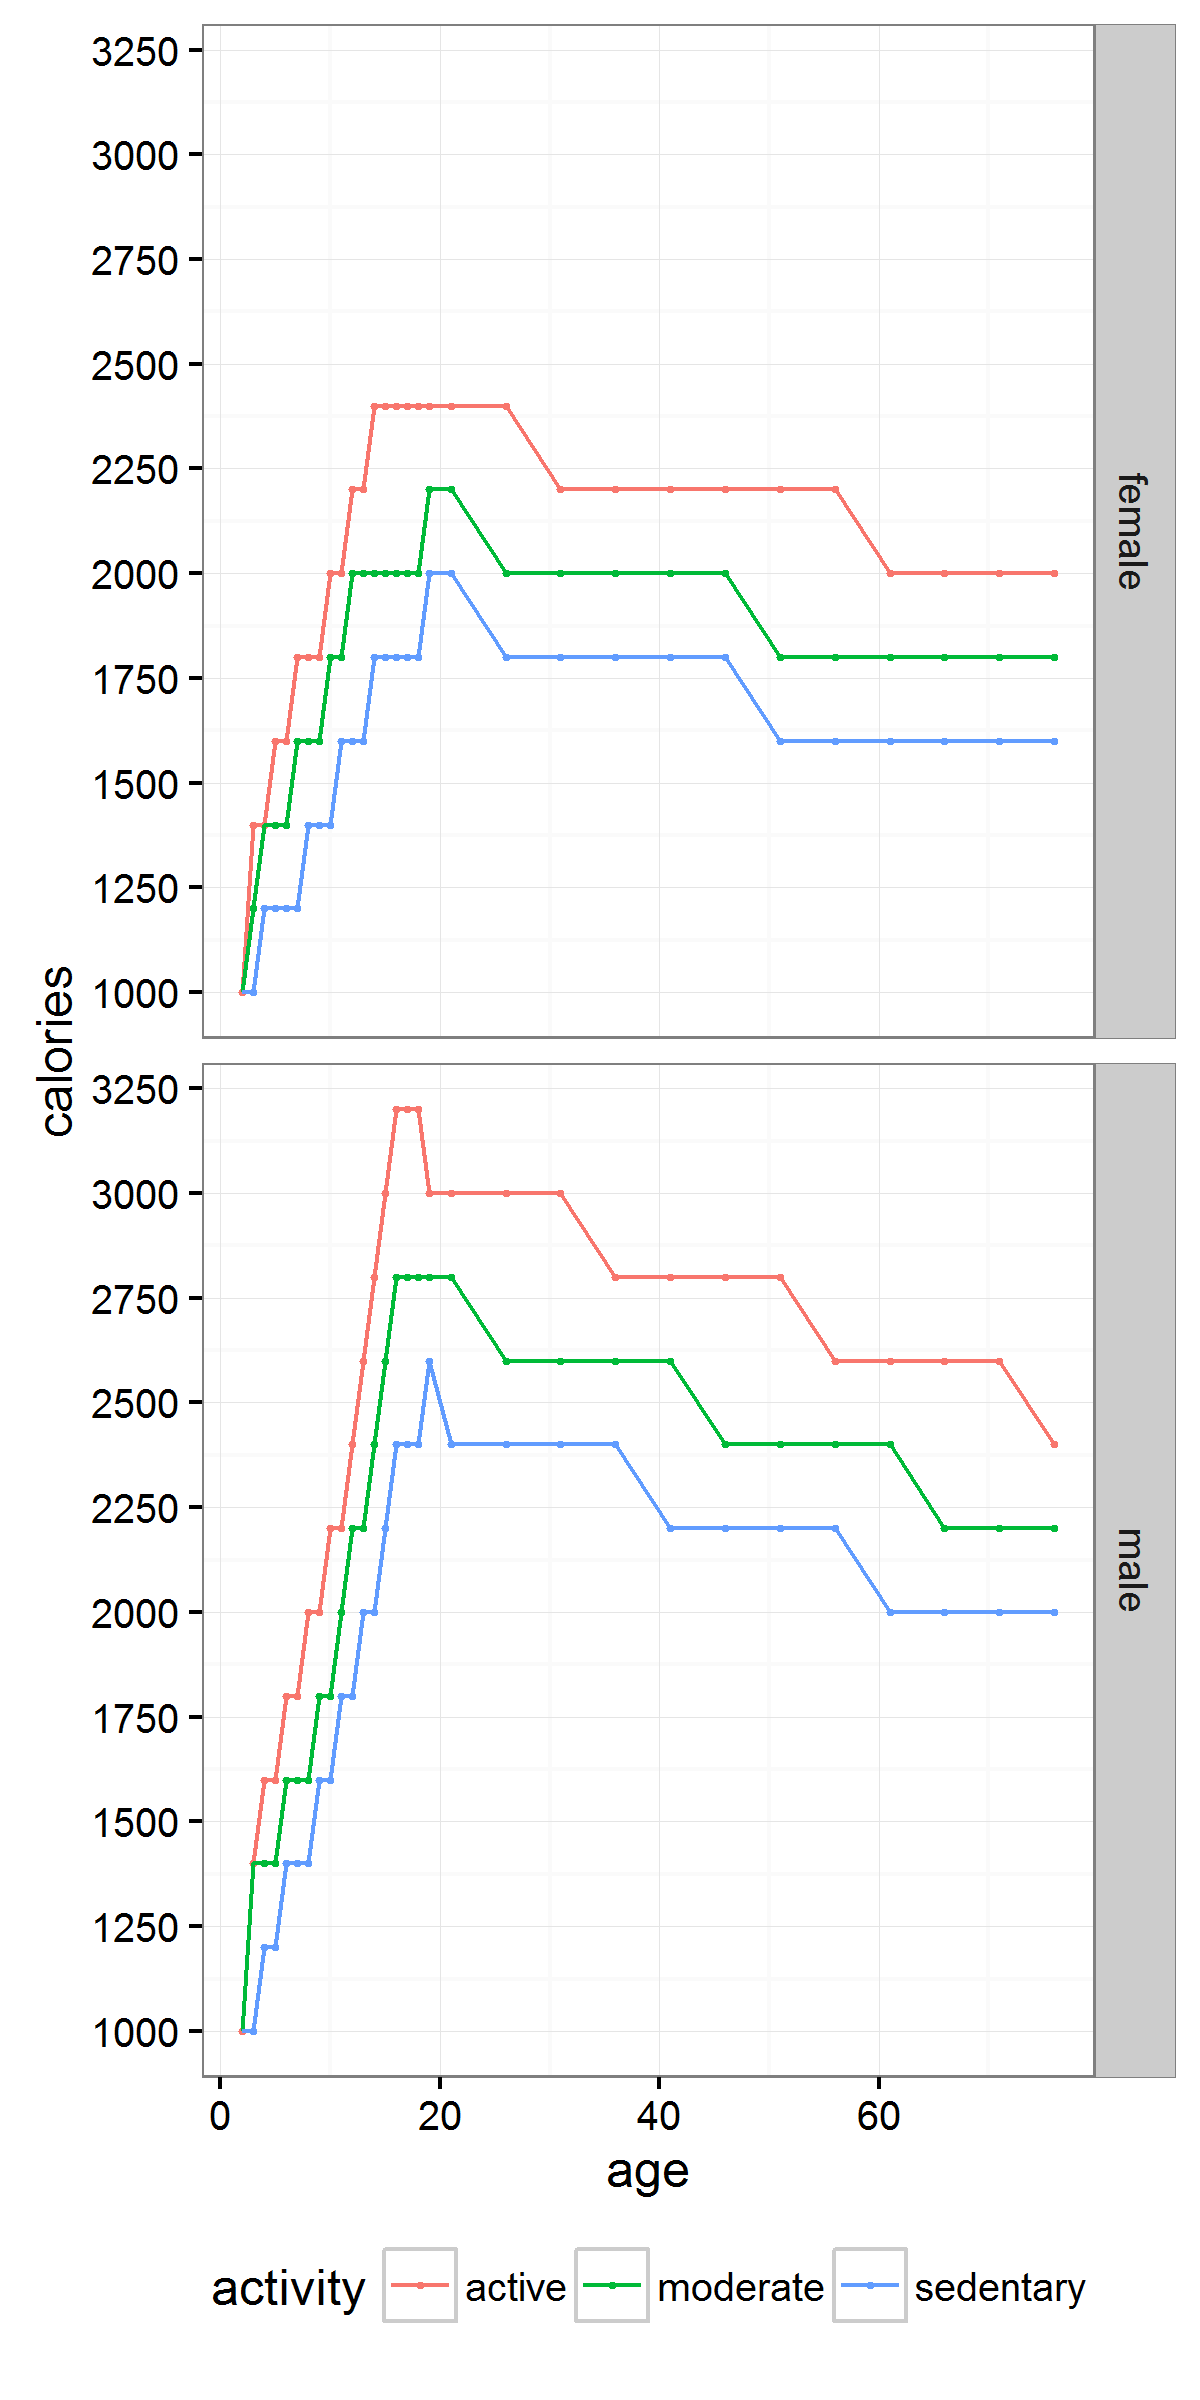
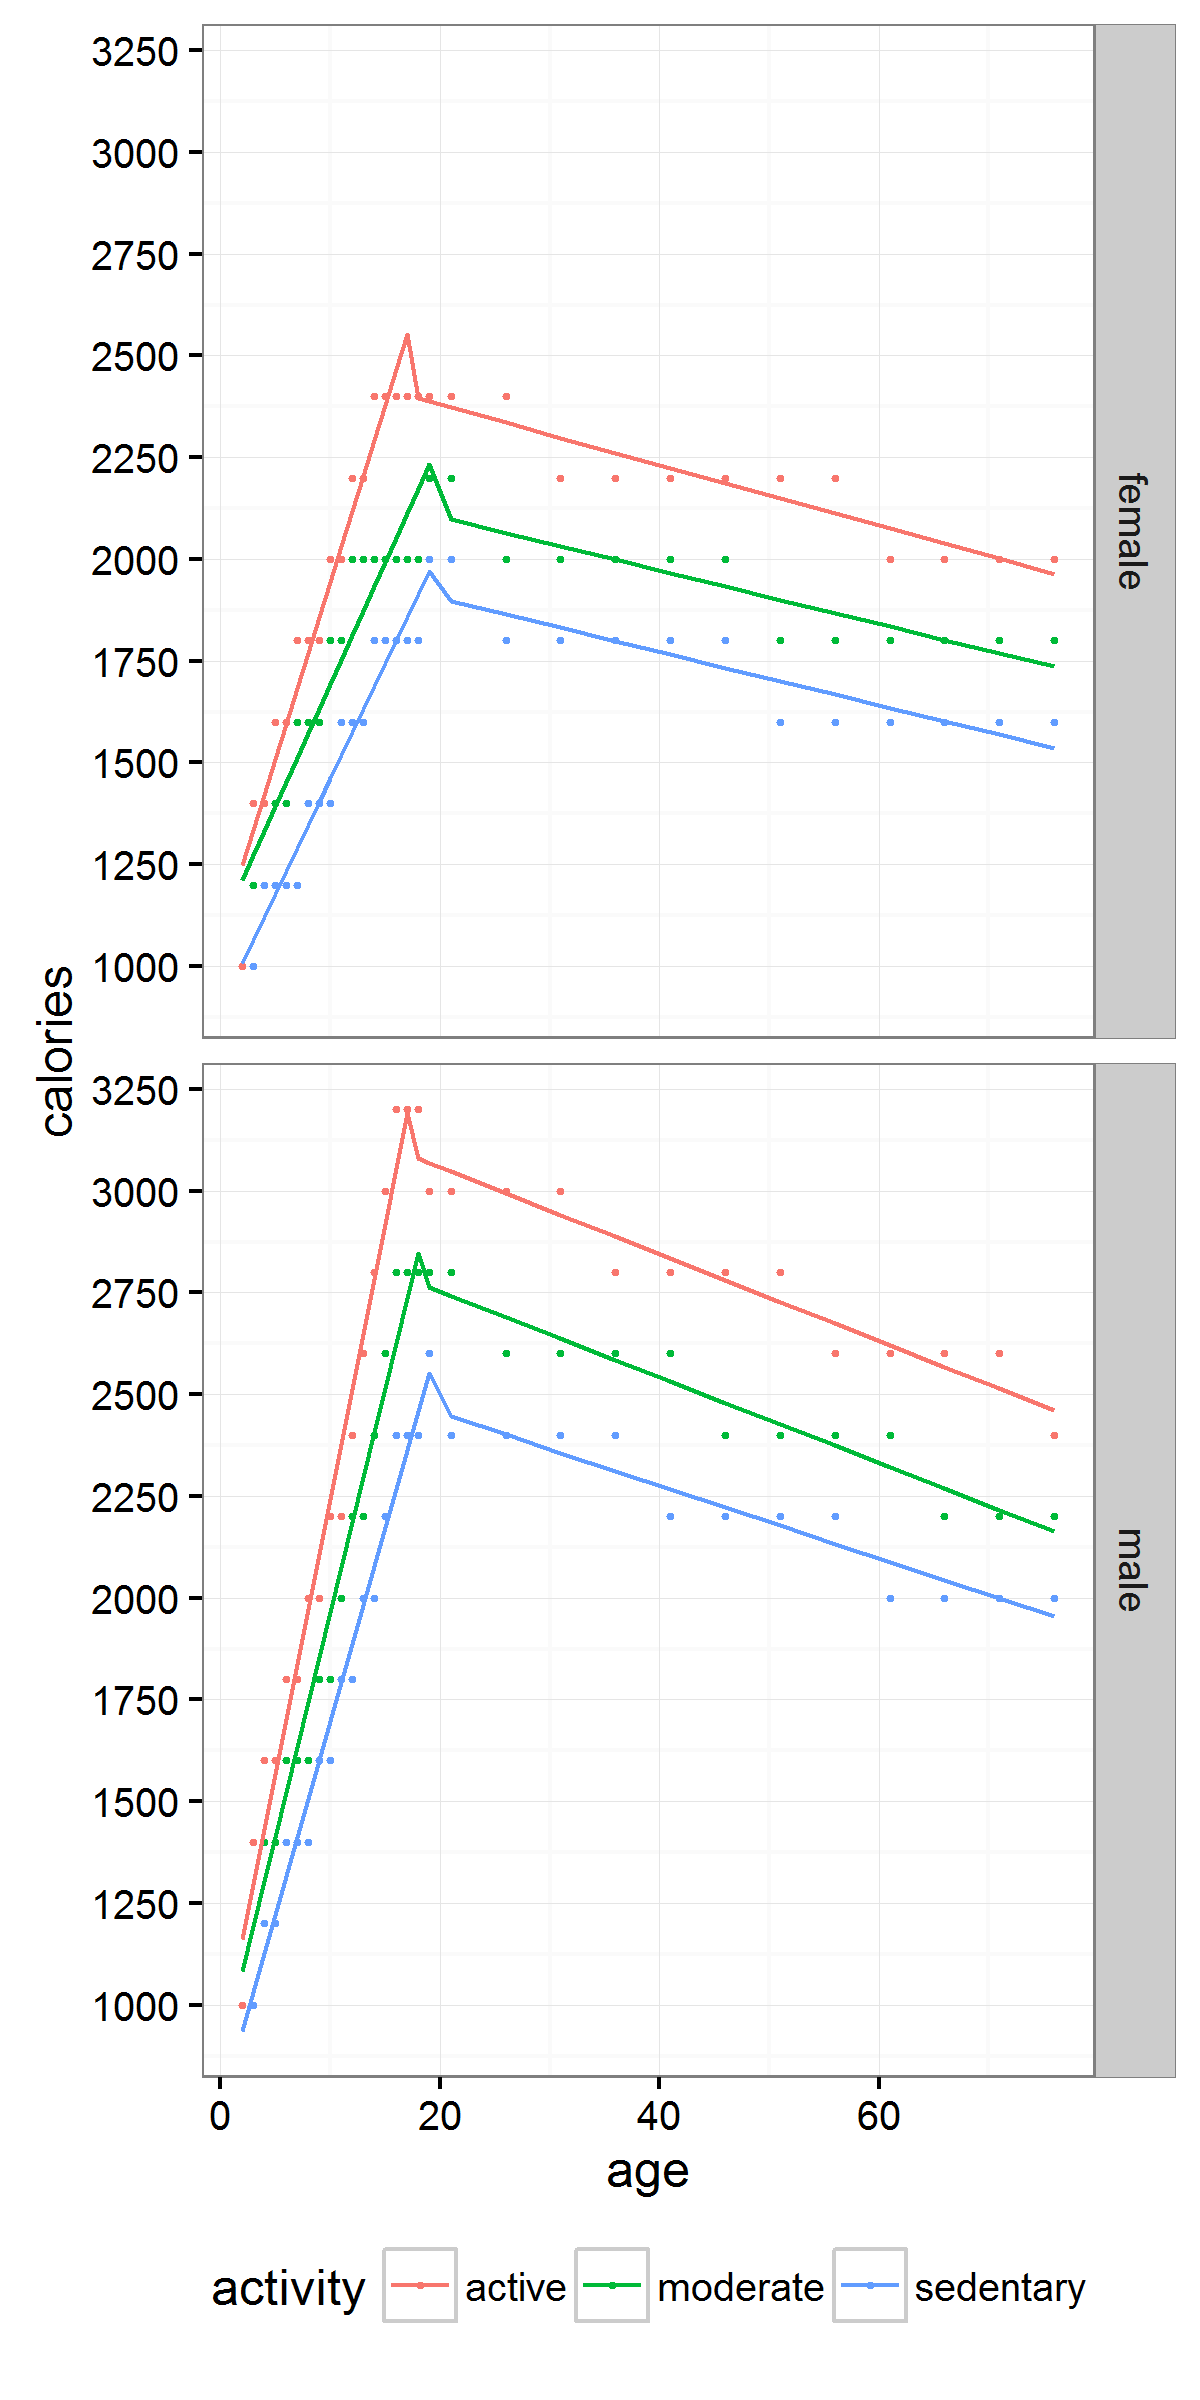
US GOVERNMENT GUIDELINES BY AGE, SEX, ACTIVITY LEVEL
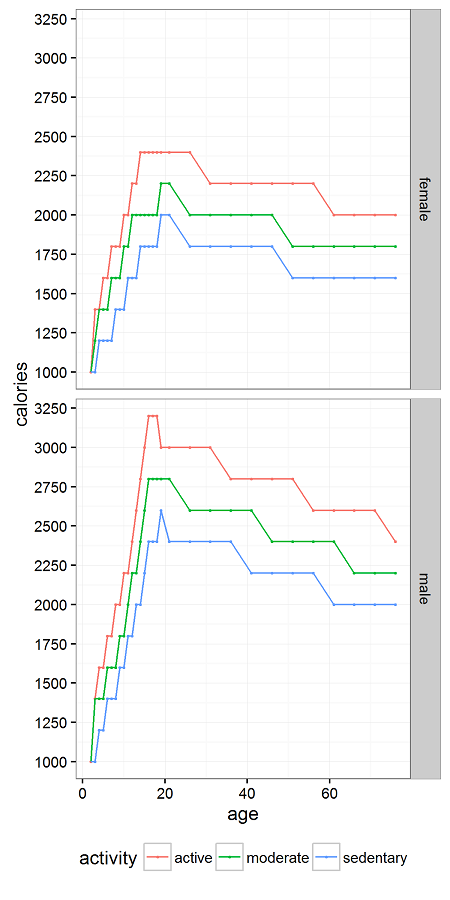
Click to enlarge
At Decision Science News, we are always on the lookout for rules of thumb.
Our colleague Justin Rao was thinking it would be useful to express calories as a percentage of daily calories. So instead of a coke being 150 calories, you could think of it as 7.5% of your daily calories. Or whatever. The whatever is key.
This is an example of putting unfamiliar numbers in perspective.
So, we were then interested to see if there would be an easy rule of thumb for people to calculate how many calories per day they should be eating, so that they could re-express foods as a percentage of that.
We found some calorie guidelines on the Web published by the US government. With the help of Jake Hofman, we used Hadley Wickham‘s rvest package to scrape them and his other tools to process and plot them.
The result is above. If you have any ideas on how to fit it elegantly, let us know.
We tried a number of fits. Lines are good for heuristics, so we made a bi-linear fit to the raw data (in points). We’re all grownups reading this blog, so let’s focus on the lines to the right of the peak.
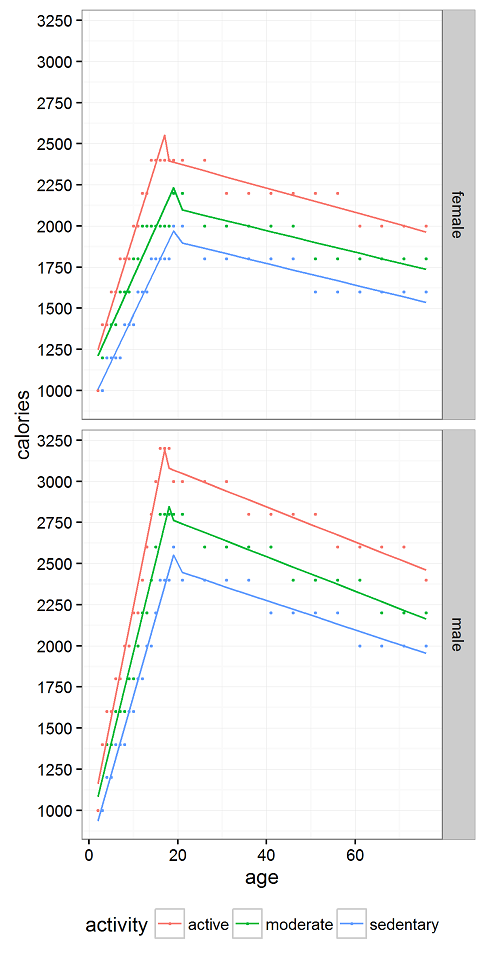 Click to enlarge
Time to make the heuristics. For women, you need about 65 fewer calories per day for every decade after age 20. For men, you need about 105 fewer calories per day for every decade after age 20. Or let’s just say 70 and 100 to keep it simple.
So, if you have an opposite sex life partner (OSLP?), keep in mind that you may need to cut back by more or fewer calories as the person across the table as you age together. Same sex life partner (SSLP?), cut back the same amount. Just don’t go beyond the range of the chart. The guidelines suggest even sedentary men shouldn’t eat fewer than 2,000 calories a day at any age. For women, that number is 1650.
REFERENCES
Barrio, Pablo J., Daniel G. Goldstein, & Jake M. Hofman. (2016). Improving comprehension of numbers in the news. ACM Conference on Human Factors in Computing Systems (CHI ’16). [Download]
The R code, below, has some other attempts at plots in it. You may be most interested in it as a way to see rvest in action. Or just to get the data.