[ View menu ]

October 11, 2011

Our research meets Saturday Night Live

Filed in Articles ,Gossip ,Ideas ,Programs ,Research News
Subscribe to Decision Science News by Email (one email per week, easy unsubscribe)


AWKWARD FUTURE SELF INTERACTIONS

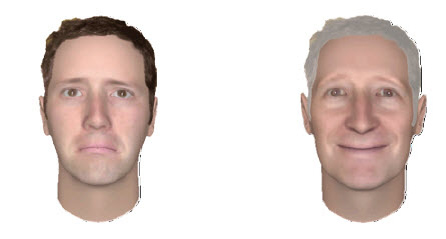
Decision Science News readers know about Hal Hershfield and Dan Goldstein‘s experiments in which they exposed people to interactive virtual-reality movies of their future selves to see how it would impact their saving behavior (pictured above). The idea was sent up in three Saturday Night Live fake commercials for Lincoln Financial (hat tip: Jake for alerting us). The SNL interactions with the future self were a lot more awkward than ours, but maybe that’s a good thing for changing behavior.

Links (mildly disturbing):

After seeing that, you may want to check out a selection of more wholesome media concerning our research.

Hershfield, H. E., Goldstein, D. G., Sharpe, W. F., Fox, J., Yeykelis, L., Carstensen, L. L., & Bailenson, J. N. (2011). Increasing saving behavior through age-progressed renderings of the future self. Journal of Marketing Research, 48, S23-S37.

Wall Street Journal Article Meet ‘Future You.’ Like What You See?

New York Times Article Some novel ideas for improving retirement income

Allianz report featuring the research Behavioral Finance and the Post-Retirement Crisis

October 5, 2011

Do cents follow Benford’s Law?

Filed in Ideas ,R
Subscribe to Decision Science News by Email (one email per week, easy unsubscribe)

MANY THINGS FOLLOW BENFORD’S LAW. CENTS DON’T.

A commenter on our last post brought up Benford’s law, the idea that naturally occurring numbers follow a predictable pattern. Does Benford’s law apply to the cent amounts taken from our 32 million grocery store prices?

Benford’s law, if you don’t know about it, is an amazing thing. If you know the probability distribution that “natural” numbers should have, you can detect where people might be faking data: phony tax returns, bogus scientific studies, etc.

In Benford’s law, the probability of the leftmost digit of a number being d is

log10(d + 1) – log10(d)

(according to the Wikipedia page, anyway).

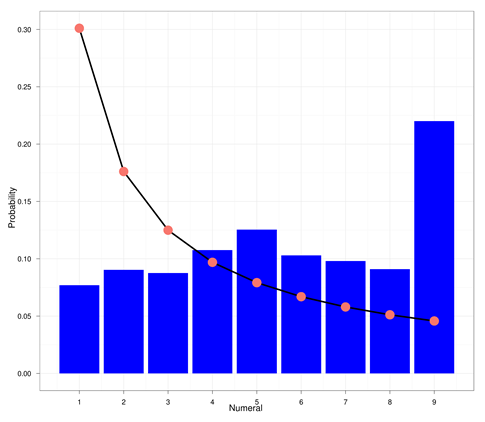
In the chart above, we plot the predictions of Benford’s law in red points. The distribution of leftmost digits in our cents data is shown in the blue bars.

As the chart makes plain, cents after the dollar do not seem distributed in a Benford-like manner. And no one is “faking” cents data. It is simply that Benford’s is a domain specific heuristic. Grocery store prices seem to be chosen strategically. Look at all those nines. Perhaps dollar (as opposed to cent) prices in the grocery store are distributed according to Benford, but we leave that as an exercise for the reader.

Want to play with it yourself? The R / ggplot2 code that made this plot is below, and the anyone who wants our trimmed down, 12 meg, version of the Dominick’s database (just these categories and prices) is welcome to it. It can be downloaded here: http://dangoldstein.com/flash/prices/.

if (!require("ggplot2")) install.packages("ggplot2")

orig = read.csv("prices.tsv.gz", sep = "\t")
orig$cents = round(100 * orig$Price)%%100
# First digit
orig$fd = with(orig, ifelse(cents < 10, round(cents), cents%/%10))  
sumif = function(x) {sum(orig$fd == x)}
vsumif = Vectorize(sumif)
df = data.frame(Numeral = c(1:9), count = vsumif(1:9))
df$Probability = df$count/sum(df$count)
ben = function(d) {log10(d + 1) - log10(d)}
df$benford = ben(1:9)
p = ggplot(df, aes(x = Numeral, y = Probability)) + theme_bw()
p = p + geom_bar(stat = "identity", fill = I("blue")) 
p = p + scale_x_continuous(breaks = seq(1:9))
p = p + geom_line(aes(x = Numeral, y = benford, size = 0.1))
p = p + geom_point(aes(x = Numeral, y = benford, color = "red", size = 1))
p + opts(legend.position = "none")
ggsave("benford.png")

ADDENDUM 1:

Plyr / ggplot author Hadley Wickham submitted some much prettier Hadleyfied code, which I studied. It wasn't quite counting the same thing my code counts, so I modified it so that they do the same thing. Most of the difference had to do with rounding. The result is here:

orig2 <- read.csv("prices.tsv.gz", sep = "\t")
orig2 <- mutate(orig2,
  cents = round(100 * Price) %% 100,
  fd = ifelse(cents<10,round(cents),cents %/% 10))
df2 <- count(orig2, "fd")
df2 <- mutate(df2,
  prob = prop.table(freq),
  benford = log10(fd + 1) - log10(fd + 0))
ggplot(df2, aes(x = fd, y = prob)) +
  geom_bar(stat = "identity", fill = "blue") +
  geom_line(aes(x = fd, y = benford, size = 0.1)) +
  geom_point(aes(x = fd, y = benford, color = "red", size = 1)) +
  theme_bw()
  scale_x_continuous(breaks = seq(1:9))

Playing with system.time() if found that the "mutate" command in plyr is slightly faster than my two calls to modify "orig" and much more compact. Lesson learned: Use mutate over separate calls and over "tranform".

My application of calls to sum(orig$fd==x) is faster than Hadley's count(orig2, "fd"), however "count" is much more general purpose and faster than "table" according to my tests, so I will be using it in the future.

ADDENDUM 2:

Big Data colleague Jake Hofman proves that awk can do this much faster than the R code above:

zcat prices.tsv.gz | awk 'NR > 1 {cents=int(100*$2+0.5) % 100;
counts[substr(cents,1,1)]++} END {for (k in counts) print k,
counts[k];}' > benford.dat

Jake's code runs in about 20 seconds, mine and Hadley's runs in about a minute.

September 30, 2011

Dollars and cents: How are you at estimating the total bill?

Filed in Ideas ,R
Subscribe to Decision Science News by Email (one email per week, easy unsubscribe)

ROUNDING HEURISTICS AND THE DISTRIBUTION OF CENTS FROM 32 MILLION PURCHASES

When estimating the cost of a bunch of purchases, a useful heuristic is rounding each item to the nearest dollar. (In fact, on US income tax returns, one is allowed to round and not report the cents). If prices were uniformly distributed, the following two heuristics would be equally accurate:

* Rounding each item up or down to the nearest dollar and summing
* Rounding each item down, summing, and adding a dollar for every two line items (or 50 cents per item).

But are prices uniformly distributed? Decision Science News wanted to find out.

Fortunately, our Alma Mater makes publicly available the famous University of Chicago Dominick’s Finer Food Database, which will allow us to answer this question (for a variety of grocery store items at least).

We looked at over 32 million purchases comprising:

* 4.8 million cereal purchases
* 2.2 million cracker purchases
* 1.7 million frozen dinner purchases
* 7.2 million frozen entree purchases (though we’re not sure how they differ from “dinners”)
* 4.1 million grooming product purchases
* 4.3 million juice purchases
* 3.3 million laundry product purchases and
* 4.7 million shampoo purchases

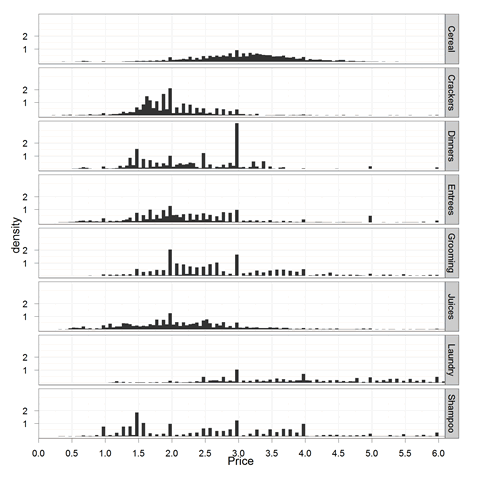
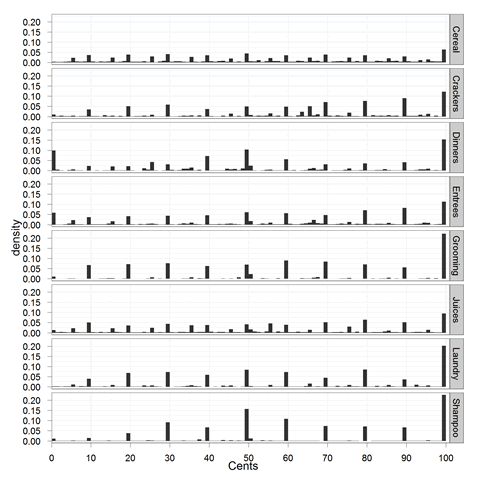
The distribution of their prices can be seen above. But what about the cents? We focus down on them here:

As is plain, there are many “9s prices” — a topic well-studied by our marketing colleagues — and there are more prices above 50 cents then below it. The average number of cents turns out to be 57 (median 59).

In sum (heh), it pays to round properly, though we do think some clever heuristics can exploit the fact that each dollar has on average 57 cents associated with it.

Anyone who wants our trimmed down, 11 meg, version of the Dominick’s database (just these categories and prices) is welcome to it. It can be downloaded here: http://dangoldstein.com/flash/prices/.

Plots are made in the R language for statistical computing with Hadley Wickham’s ggplot2 package. The code is here:

if (!require("ggplot2")) install.packages("ggplot2")
library(ggplot2)
orig = read.csv("prices.tsv.gz", sep = "\t")
summary(orig)
orig$cents = orig$Price - floor(orig$Price)
#sampledown
LEN = 1e+06
prices = orig[sample(1:nrow(orig), LEN), ]
prices$cents = round((prices$Price - floor(prices$Price)) *
    100, 0)
summary(prices)
p = ggplot(prices, aes(x = Price)) + theme_bw()
p + stat_bin(aes(y = ..density..), binwidth = 0.05,
    geom = "bar", position = "identity") + coord_cartesian(xlim = c(0,
    6.1)) + scale_x_continuous(breaks = seq(0, 6, 0.5)) +
    scale_y_continuous(breaks = seq(1,
    2, 1)) + facet_grid(Item ~ .)
ggsave("prices.png")
p = ggplot(prices, aes(x = cents)) + theme_bw()
p + stat_bin(aes(y = ..density..), binwidth = 1, geom = "bar",
    position = "identity",right=FALSE) + coord_cartesian(xlim = c(0, 100)) +
    scale_x_continuous(name = "Cents", breaks = seq(0, 100, 10)) +
    facet_grid(Item ~ .)
ggsave("cents.png")

September 19, 2011

OPIM Professorship at Wharton, rank open

Filed in Jobs ,SJDM
Subscribe to Decision Science News by Email (one email per week, easy unsubscribe)

PROFESSORSHIP AT THE DEPARTMENT OF OPERATIONS AND INFORMATION MANAGEMENT (OPIM), THE WHARTON SCHOOL, UNIVERSITY OF PENNSYLVANIA

whar

The Operations and Information Management Department at the Wharton School, the University of Pennsylvania, is home to faculty with a diverse set of interests in decision-making, information technology, information-based strategy, operations management, and operations research. We are seeking applicants for a full-time, tenure-track faculty position at any level: Assistant, Associate, or Full Professor. Applicants must have a Ph.D. (expected completion by June 30, 2013 is acceptable) from an accredited institution and have an outstanding research record or potential in the OPIM Department’s areas of research. Candidates with interests in multiple fields are encouraged to apply. The appointment
is expected to begin July 1, 2012 and the rank is open.

More information about the Department is available at:
http://opimweb.wharton.upenn.edu/

Interested individuals should complete and submit an online application via our secure website, and must include:

-A cover letter (indicating the areas for which you wish to be considered)
-Curriculum vitae
-Names of three recommenders, including email addresses [junior-level candidates]
-Sample publications and abstracts
-Teaching summary information, if applicable (courses taught, enrollment and evaluations)

To apply please visit our web site:
http://opim.wharton.upenn.edu/home/recruiting.html

Further materials, including (additional) papers and letters of recommendation, will be requested as needed. To ensure full consideration, materials should be received by November 14th, 2011, but applications will continue to be reviewed until the position is filled.

Contact:
Maurice Schweitzer
The Wharton School
University of Pennsylvania
3730 Walnut Street
500 Jon M. Huntsman Hall
Philadelphia, PA 19104-6340

The University of Pennsylvania values diversity and seeks talented students, faculty and staff from diverse backgrounds. The University of Pennsylvania is an equal opportunity, affirmative action employer. Women, minority candidates, veterans and individuals with disabilities are strongly encouraged to apply.

September 12, 2011

Enter your strategy in a tournament, win thousands of Euros

Filed in Programs ,Research News
Subscribe to Decision Science News by Email (one email per week, easy unsubscribe)

SECOND SOCIAL LEARNING STRATEGIES TOURNAMENT: 25,000 EUR PRIZE MONEY

DSN received the following announcement, which should be of interest to agent-based modelers out there. The first tournament led to a Science paper, not a bad outcome.

We would like to invite you, the members of your research group, and your colleagues to participate in The Second Social Learning Strategies Tournament, which we hope will interest you. The tournament, which has a total of 25,000 euro available as prize money, is now open for entries.

The tournament is a competition designed to establish the most effective means to learn in a complex, variable environment.

In recent years, there has been a lot of interest (spanning several research fields, but especially economics, anthropology, and biology) in the problem of how best to acquire valuable information from others. The first Social Learning Strategies Tournament, inspired by Robert Axelrod’s famous Prisoner’s Dilemma tournaments on the evolution of cooperation, attracted over 100 entries from all around the world, and a paper detailing the results was published in the journal Science in 2010*. The high level of interest convinced us that it would be worthwhile to organise a second tournament in which some of the restricting assumptions of the first could be relaxed, so as to explore a broader range of questions.We have received funding for this from the European Research Council, and a committee of world-leading scientists have helped us to design the tournament game, including Sam Bowles (Santa Fe Institute), Rob Boyd (UCLA), Marc Feldman (Stanford), Magnus Enquist (Stockholm), Kimmo Erikkson (Stockholm) and Richard McElreath (UC Davis).

Entrants will be required to submit behavioural strategies detailing how to respond to the problem of resource gain in a complex, variable environment through combinations of individual and social learning.

Three extensions to the first tournament game will (i) explore the effects of learners being able to select from whom to learn, (ii) allow agents to refine existing behavior cumulatively, and (iii) place the action in a spatially structured population with multiple demes. A total of 25,000 euro prize money is available, divided into three 5,000 euro prizes for the best strategy under any single extension, and a 10,000 euro prize for the best strategy under all three extensions.

The competition is now open for entries, with a closing date of

February 28 2012. More information can be found at:

http://lalandlab.st-andrews.ac.uk/tournament2/

We would like to encourage you, the members of your laboratories, and your colleagues and collaborators, to participate in this competition.Please do forward this message to anyone you think might be interested. We would also be grateful if you would print out and post the attached flier on your notice boards, and forward it to anyone you think might be interested.

We hope that this tournament will increase understanding of, and stimulate research on, the evolution of learning, as Axelrod’s tournament did for the evolution of cooperation.

*Rendell et al. (2010) Why copy others? Insights from the Social Learning Strategies Tournament. Science 328: 208-213

Image credit: Goldstein, D. G. (2009). Heuristics. In P. Hedström & P. Bearman (Eds.), The Oxford Handbook of Analytical Sociology. (pp. 140-164). New York: Oxford University Press. [Download]

September 5, 2011

Publish your health nudges

Filed in Articles ,Programs ,Research News
Subscribe to Decision Science News by Email (one email per week, easy unsubscribe)

SPECIAL ISSUE OF HEALTH PSYCHOLOGY ON BEHAVIORAL ECONOMICS

Health has a major impact on both individuals and nations. Health problems
can impact a person’s emotional, financial and social state; they can also
affect a nation’s financial and social standing. Indeed, countries across
the globe are currently battling the increasing costs of health care
delivery, while others are trying to modernize their systems. Furthermore,
most nations face similar health related challenges such as reducing
unhealthy behaviors (poor diet and smoking), increasing healthy behaviors
(exercising), assisting disadvantaged population gain better access to
health services, and improving adherence to medical treatment.

According to the Surgeon General’s Office the leading causes of mortality in
the U.S. have substantial behavioral components. It is no wonder, therefore,
that both psychologists and economists have been among the pioneers in
studying components associated with health behaviors and have provided a
range of successful behaviorally based prevention and treatment options.
Yet, the sheer extent of these problems calls for a more interdisciplinary
approach. In recent years a growing number of researchers have turned to
behavioral and experimental economics in the hopes of providing additional
insights to facilitate positive health behavior changes.

The aim of this special issue is to bring together the latest research in
behavioral and experimental economics on health related issues, stimulate
cross disciplinary exchange of ideas (theories, methods and practices)
between health economists and psychologists, and provide an opportunity to
simulate novel and creative ways to tackle some of the most important health
challenges we currently face. This special issue will be of interest not
only to a diverse range of researchers but to health professionals,
practitioners and policy makers alike.

With this call for papers, we hope to attract manuscripts that are
outstanding empirical and/or theoretical exemplars of research on any health
related topic from a behavioral and/or experimental economic perspective. We
anticipate studies will focus on a range of topics, including, but not
limited to: Smoking, Dietary choices, Adherence to treatment, Decision
making, Risk taking behavior, Choice architecture, Information asymmetry and
use of monetary incentives to alter behavior. We expect papers to reflect a
variety of methodologies but to highlight implications of the research for
practitioners and policy makers.

Authors should submit a short proposal (maximum of 400 words) that outlines
the plan for a full manuscript* to Yaniv Hanoch, PhD *and* Eric Andrew
Finkelstein*, PhD, guest editors for the special issue, by *March 1, 2012*.
The proposal should outline the study question, methods and findings of the
proposed submission and note how the paper will align with the theme of the
special issue. *Submissions are due August 1, 2012.* Papers should be
prepared in full accord with the *Health Psychology* Instructions to Authors
and submitted through the Manuscript Submission
Portal.
All manuscripts will be peer reviewed. Some papers not included in a
specific special section may be accepted for publication in *Health
Psychology* as regular papers. Please indicate in the cover letter
accompanying your manuscript that you would like to have the paper
considered for the Special Series on Health Psychology meets Behavioral
Economics.

August 30, 2011

The Effectiveness of Simple Decision Heuristics: Forecasting Commercial Success for Early-Stage Ventures

Filed in Articles ,Research News
Subscribe to Decision Science News by Email (one email per week, easy unsubscribe)

PREDICTING INVENTIONS’ SUCCESS WITH SIMPLE RULES

Most inventions fail to be commercialized profitably. Wouldn’t it be nice to be able to predict which ones will? This paper, by Astebro and Elhedhli argues that a simple rule can do quite well making forecasts in a difficult real-world setting.

CITATION
Åstebro, T. and Elhedhli, S. (2006). The Effectiveness of Simple Decision Heuristics: Forecasting Commercial Success for Early-Stage Ventures. Management Science, 52(3), 395-409.

ABSTRACT
We investigate the decision heuristics used by experts to forecast that early-stage ventures are subsequently commercialized. Experts evaluate 37 project characteristics and subjectively combine data on all cues by examining both critical flaws and positive factors to arrive at a forecast. A conjunctive model is used to describe their process, which sums “good” and “bad” cue counts separately. This model achieves a 91.8% forecasting accuracy of the experts’ correct forecasts. The model correctly predicts 86.0% of outcomes in out-of-sample, out-of-time tests. Results indicate that reasonably simple decision heuristics can perform well in a natural and very difficult decision-making context.

August 22, 2011

JDM 2011 Seattle: Novermber, 5-7, 2011

Filed in Conferences ,SJDM ,SJDM-Conferences
Subscribe to Decision Science News by Email (one email per week, easy unsubscribe)

32ND ANNUAL CONFERENCE OF THE SOCIETY FOR JUDGMENT AND DECISION MAKING, NOV 5-7, 2011, SEATTLE, WA, USA.

Now might be a good time to get a hotel reservation and flight to this year’s JDM conference. The Sheraton Seattle Hotel (map) is offering a discounted rate to the Psychonomics Society Meeting attendees, which JDM attendees can take advantage of (hotel rate information).

Decision Science News will see you in Seattle!

August 15, 2011

How many NYC restaurants get As on their health inspections?

Filed in Gossip ,Ideas ,R
Subscribe to Decision Science News by Email (one email per week, easy unsubscribe)

WITH DATA LIKE THESE, WHO CAN SAY?

Decision Science News is no stranger to misleading infographics in free New York newspapers. We could upgrade to real newspapers, but we find that playing “spot the infographic flaw” really makes the time fly on the subway.

We saw the above graphic in a paper called Metro. In New York City, restaurants are graded by health inspectors and receive an “A”, “B”, or “C” rating (any lower than C and they are shut down). This graphic was supposed to inform us about the percentage of restaurants with As, by borough and citywide. Can you spot the goof?

You might be curious how the weighted average of 73.3%, 62.8%, 63.6%, 61.4%, and 62.2% could be 69% (shown in the red box) given that 73.3% gets the smallest weight in the average.

Ignoring the top row in the table, a simple calculation from the remaining numbers gives 63.6% as the percentage of restaurants with As. But which stat is correct? Perhaps the top row is correct and some other numbers in the table are wrong.

Amazingly, the same day, AM New York, yet another free paper, ran more or less the same story, but with different numbers. Based on those, 68% of restaurants had As. Disappointingly, all their by-borough percentages failed to line up with hose from Metro (see R code at end of this article).

Decision Science News then tried to cut out the middleman and hit the New York City Department of Health and Mental Hygiene Website. Pie charts are much maligned, but when it comes to the topic of food safety, why not? If it were up to us, we would have drawn in a crust and whipped cream, but then our taste in charts is controversial.


Taken from http://www.nyc.gov/html/doh/downloads/pdf/rii/restaurant-grading-1-year-report.pdf

So, we now have four candidate figures, 69%, 63.6%, 68% and 69%, which are in no way independent, but do suggest the answer is “just shy of 70%”.

Another interesting tidbit in the health department’s report is that the restaurant grades may be effective at changing restaurants’ behavior. At first inspection, 39% of restaurants got As, 34% got Bs, and 27% got Cs. From page 3:

Among those scoring in the B range on initial inspection, nearly 40% improved to earn an A on reinspection. Of restaurants that scored in the C range on their initial inspection, 72% improved enough to earn an A or B on re-inspection.

There you have it!

R CODE FOR R NERDS

################
#Metro data
graded=c(22454,2204,5235,9086,5030,899)
asMetrostated=c(.69,.662,.628,.636,.614,.733)
asMetrocount=round(asMetrostated*graded)
metro=data.frame(graded,asMetrostated,asMetrocount)
row.names(metro)=c("citywide","bronx","brooklyn","manhattan","queens","statenIsland")
metro
sprintf("Total graded: %d", sum(metro[2:6,1]))
sprintf("Total As: %d", sum(metro[2:6,3]))
sprintf("Percent As: %.2f", (sum(metro[2:6,3]) / sum(metro[2:6,1]) * 100))
################
#AM New York data
statenIsland=c(644,73,20,82)
queens=c(3009,601,152,806)
brooklyn=c(3197,619,152,774)
bronx=c(1394,260,54,332)
manhattan=c(5792,1006,256,1314)
am=data.frame(bronx,brooklyn,manhattan,queens,statenIsland)
am[5,]=apply(am[1:4,],2,sum)
am[6,] = am[1,]/am[5,]
row.names(am)=c("A","B","C","GradePending","total","As")
round(am,2)
sprintf("Percent As: %.2f", sum(am[1,]) / sum(am[5,]))

ADDENDUM: Thanks to the folks at katom.com for finding a broken link on this page. Check out their site for restaurant inspection info.

August 9, 2011

Third of three special JDM journal issues on the Recognition Heuristic

Filed in Articles ,Ideas ,Research News
Subscribe to Decision Science News by Email (one email per week, easy unsubscribe)

SPECIAL ISSUE: RECOGNITION PROCESSES IN INFERENTIAL DECISION MAKING

The journal Judgment and Decision Making has published the third special issue on “Recognition processes in inferential decision making (III)” edited by Julian N. Marewski, Rüdiger F. Pohl and Oliver Vitouch.  At first, there was supposed to be just one special issue on the topic, but so many good articles were received it was expanded to two (which explains our older post referring to “first of two” special issues) and now it has been expanded again to a third and final issue. All the articles address the recognition heuristic [Goldstein, D. G. & Gigerenzer, G. (2002). Models of ecological rationality: The recognition heuristic. Psychological Review, 109, 75-90.]

This volume features a nice article by John Hauser, an MIT Marketing prof and a new contributor to JDM, on how recognition-based heuristics relate to the marketing literature. We at DSN think this is a very promising area for future research.

CONTENTS OF THE THIRD SPECIAL ISSUE
Recognition-based judgments and decisions: What we have learned (so far), pp. 359-380.
Julian N. Marewski, Rüdiger F. Pohl and Oliver Vitouch

Effects of ignorance and information on judgments and decisions, pp. 381-391.
Peter Ayton, Dilek Önkal and Lisa McReynolds

The beauty of simple models: Themes in recognition heuristic research, pp. 392-395.
Daniel G. Goldstein and Gerd Gigerenzer

A marketing science perspective on recognition-based heuristics (and the fast-and-frugal paradigm), pp. 396-408.
John Hauser

Recognising the recognition heuristic for what it is (and what it’s not), pp. 409-412.
Ben R. Newell

The limited value of precise tests of the recognition heuristic, pp. 413-422.
Thorsten Pachur

On the use of recognition in inferential decision making: An overview of the debate, pp. 423-438.
Rüdiger F. Pohl

Photo adapted from S. M. Daselaar, M. S. Fleck, and R. Cabeza. (2006) Triple Dissociation in the Medial Temporal Lobes: Recollection, Familiarity, and Novelty. Journal of Neurophysiology 96, 1902-1911.