[ View menu ]

August 21, 2010

Should you believe what smart people believe about climate change?

Filed in Articles ,Gossip ,Ideas ,Research News
Subscribe to Decision Science News by Email (one email per week, easy unsubscribe)

EVALUATING THE CREDIBILITY OF ENDORSERS AND DOUBTERS OF CLIMATE CHANGE

In science, you are not supposed to believe something simply because other people believe it, even if those other people are really smart. Like the Hollywood narrator, we can think of examples where “one man (1), in a world of doubters, stands up for what he knows to be true”. Galileo was sent before the Roman Inquisition for his views, and mainstream physicists rejected Einstein’s theory of relativity; one Nobel Laureate referred to it as “a Jewish fraud” (2). Thank goodness they didn’t let the prevailing views keep them from publishing what they found.

However, despite what makes a good Hollywood story, the inconvenient truth is that if you think one thing and a lot of smarter and more knowledgeable people think you are wrong, you probably are wrong.

Sure, there’s Galileo, Einstein, the Asch experiments and Tetlock’s book, but where would we be if we didn’t take the word of those with intelligence and experience?

Really stupid, that’s where.

At a certain level of acceptance, a reasonable person will accept something as true enough to believe in and get on with life. We can’t re-run every experiment in the history of science. The good news is that due to homo sapiens’ brilliant capacity to accept some counter-intuitive matters on faith, we gullibly accept fanciful notions like atoms, viruses, and Greenland to make good decisions about chemical engineering, disease prevention, and navigation.

Even rationality, which people in the decision sciences care so deeply about, originated in the Enlightenment as a description of what smart people (les hommes éclairés) (3) believe. Rationality theory at its birth was just a theory of the cognitive psychology of smart people. As the beliefs of smart people changed over time, rationality theory bent in subservience (4).

So, here’s the question of the day. If you are a scientist, what should you believe about your beliefs when they contradict the beliefs of a lot of smart people?

Story time. In graduate school, your Decision Science News editor was chatting with his statistics professor, Steven Stigler (5). The topic was the limited usefulness of p-values. Scientists seem to wish that p-values referred to the probability that a hypothesis is true (and some actually and wrongly believe this, see 6). However, they actually reflect the probability of the data given that the null hypothesis is true. A young Decision Science News remarked that this probability isn’t all that interesting.

“Well”, Stigler said, “When the p-value is very small, it’s either the case that the null hypothesis is false, or that something extraordinary has happened. Both of those seem pretty interesting.”

End of story. Time to link story to the “one man against the world” scenario.

One man believes “not X”, the scientific world believes “X”. We the bystanders want to know the probability that either is right. But we can’t know that. Furthermore, we are not experts in every scientific discipline, and do not have time to become experts.

What we bystanders probably do is run intuitive statistics on the distribution of expert opinions. We guesstimate the probability that we’d observe the data we do (all these smart and knowledgeable standing behind “X”) given that “not X” were true. We estimate this to be a small probability. After all, the smart and knowledgeable people who become scientists are a skeptical bunch. They’re doubters by default and they all want to be Galileos who get immortalized for standing apart from the pack and being proven right. Getting the vast majority of scientists to agree on anything is a feat. We consider this small probability of expert consensus and say “either ‘one man’ is wrong or something extraordinary has happened”. We typically decide that ‘one man’ is wrong, and lo and behold, we’re usually right (7).

Ach, but it gets tricky. Opinions are not i.i.d. Some view overwhelming agreement as less convincing than a bit of disagreement. (Apparently it is written in Maimonides Law of the Sanhedrin (8) “If a Sanhedrin (i.e., a bunch of judges) opens a capital case with a unanimous guilty verdict, he is exempt, until some merit is found to acquit him.” That is, if you’re facing the death penalty and all the judges vote against you, it actually prevents you from being executed. Perhaps the idea is such unanimity is unlikely if the defendant had received a proper defense.)

All of this leads up to this week’s article from Proceedings of the National Academy of Sciences:

Expert credibility in climate change [PDF]

Although preliminary estimates from published literature and expert surveys suggest striking agreement among climate scientists on the tenets of anthropogenic climate change (ACC), the American public expresses substantial doubt about both the anthropogenic cause and the level of scientific agreement underpinning ACC. A broad analysis of the climate scientist community itself, the distribution of credibility of dissenting researchers relative to agreeing researchers, and the level of agreement among top climate experts has not been conducted and would inform future ACC discussions. Here, we use an extensive dataset of 1,372 climate researchers and their publication and citation data to show that (i) 97–98% of the climate researchers most actively publishing in the field support the tenets of ACC outlined by the Intergovernmental Panel on Climate Change, and (ii) the relative climate expertise and scientific prominence of the researchers unconvinced of ACC are substantially below that of the convinced researchers.

The authors claim that not only do most (97-98%) expert climate scientists believe in climate change, but that the small minority who doubt it are of lesser prominence and lower expertise. Publication and citation data are provided to make the argument. The Yahoo Research lunch crowd, all of whom are incredibly smart and all of whom believe in climate change, found the paper to be “awesome” and “hilarious”, but “incredibly fishy”. Sounds like good criteria for inclusion in Decision Science News.

What do you think? [PDF]

NOTES
1) Sorry to the women, but that’s what they say.
2) Einstein: Holton, Gerald (2008). Who was Einstein? Why is he still so alive? In Galison, Peter L., Gerald Holton & Silvan S. Schweber (Eds) “Einstein for the 21st Century: His Legacy in Science, Art, and Modern Culture”. Also, as a Jew I take offense at the Nazi presumption that the Jews couldn’t come up with a better fraud than the theory of relativity.
3) Pardonnez moi, les femmes, main ce qu’on dit.
4) Daston, Lorraine. (1988). Classical Probability in the Enlightenment. Princeton: Princeton University Press.
5) As a graduate student, your Editor become very fond of Statistics and took so many graduate courses, he fulfilled the requirements for a Master’s degree. However, the University of Chicago had a rule that grad student scholarships covered only one Master’s degree and your Editor had already received one in Psychology. Since the costs had already been incurred, your Editor asked if he could give back the Master’s in Psych. The University was not amused.
6) Oakes, M. (1986). Statistical inference: A commentary for the social and behavioral sciences. Chichester, UK: Wiley.
7) Then we die. Sometimes we’re proven wrong after death, but as long as we were correct while alive it’s no grave concern.
8) Chapter 9

August 11, 2010

Which chart is better?

Filed in Articles ,Gossip ,Ideas ,R ,Tools
Subscribe to Decision Science News by Email (one email per week, easy unsubscribe)

CHART CRITICS, GRAPHICS CURMUDGEONS, COME ONE COME ALL

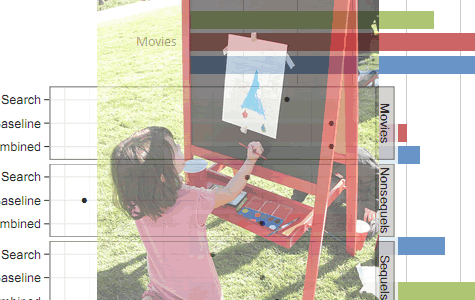
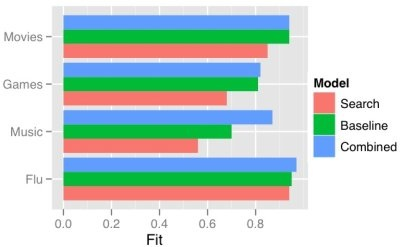
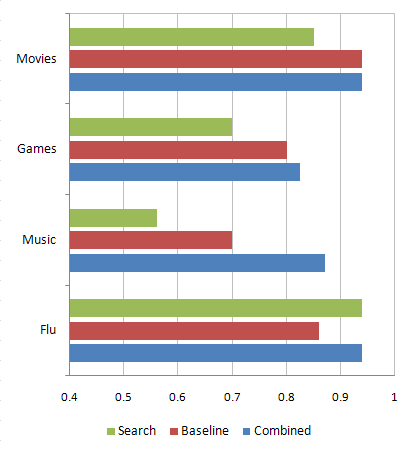
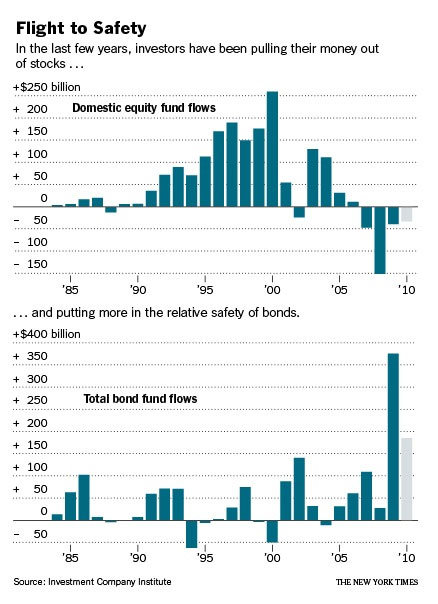
Once upon a time there was this graph (graph 1).

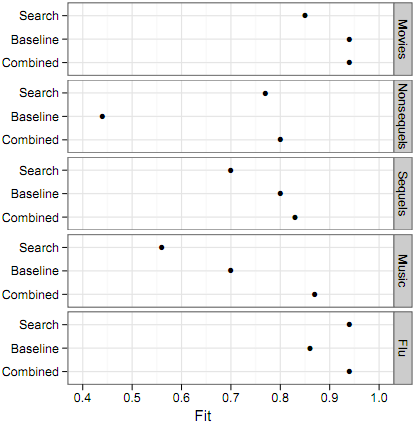
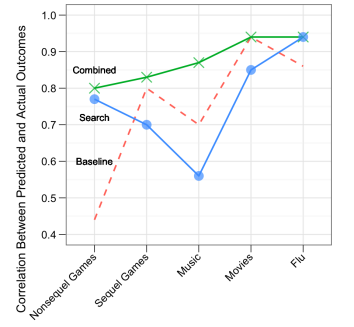
Andrew Gelman went all graphics curmudgeon on it, calling it an “ugly, sloppy bit of data graphics“, so it became this graph (graph 2).

Now the question is, which is better: graph 2 or graph 3?

Please use the comments and logic. Thank you.

ADDENDUM

As a result of all the feedback here. The following chart was chosen for use in the publication (Proceedings in the National Academy of Sciences):

Photo credit: http://www.flickr.com/photos/emeryjl/2104152944/. Graphs 1 and 3 have four categories and graph 2 has five categories. Also, there is a missing label on graph 3’s horizontal axis. Assume you are deciding among graphs of these basic forms that have equivalent numbers of groups and identical axis labeling.

August 5, 2010

ACR 2010 Jacksonville uses green defaults

Filed in Conferences ,SJDM
Subscribe to Decision Science News by Email (one email per week, easy unsubscribe)
ASSOCIATION FOR CONSUMER RESEARCH CONFERENCE, OCT 7-10, 2010

What: The Association for Consumer Research Annual North American Conference [Website]
Where: Jacksonville, FL
Hotel: The Hyatt Regency [Map] [Booking]
When: OCT 7-10, 2010
Registration: Available now online
Early-bird deadline: Sept 1. Second price hike at Sept 25th.

ACR 2010 Jacksonville is open for registration!

Decision Science News notices that this year, the conference uses “green defaults”. Innovative! Check it out:

  • You will have the option to opt out of the complete program given at the conference. You can build your own program on the ACR website by going to www.acrweb.org/acr and signing in. Once there, choose the “program” option, and you will see the new tool which you can utilize. Print your customized program and bring it with you!
  • The default meal is vegetarian. You will have the option to opt out of the vegetarian meal.

Build-your-own-program is neat. We usually look at about half of the program, and end up needing about 20% of it at the conference. They have some other nudges as well:

  • You will have the option of buying carbon offsets for your flight.
  • You can choose the electronic version of the proceedings instead of a hardcover copy and receive a $20 discount.

The discount for the e-proceedings seems like a classic incentive. Decision Science News just registered and found that they used no default (forced choice) for this question. They could have made the default the green one and said “hardcover available for an extra $20”. In any case, we are glad to see research put to use.

July 30, 2010

First of two JDM special issues on the Recognition Heurisitic

Filed in Articles ,Ideas ,Research News ,SJDM
Subscribe to Decision Science News by Email (one email per week, easy unsubscribe)

SPECIAL ISSUE: RECOGNITION PROCESSES IN INFERENTIAL DECISION MAKING

The journal Judgment and Decision Making today published a special issue on “Recognition processes in inferential decision making” edited by Julian N. Marewski, Rüdiger F. Pohl and Oliver Vitouch. The special issue turns out to be the first of two special issues, something the editors had not anticipated:

What was originally planned as one issue consisting of about 6 contributions turned into two volumes with about 20 submitted articles, some of which are still under review. All submissions were and are subject to Judgment and Decision Making’s peer review process, under the direction of the journal’s editor, Jonathan Baron, and us.

Here is how the editors describe the contents of the two special issues:

Let us briefly provide an overview of the contents of the two issues. The first issue presents 8 articles with a range of new mathematical analyses and theoretical developments on questions such as when the recognition heuristic will help people to make accurate inferences; as well as experimental and methodological work that tackles descriptive questions; for example, whether the recognition heuristic is a good model of consumer choice.

The forthcoming second issue strives to give an overview of the past, current, and likely future debates on the recognition heuristic, featuring comments on the debates by some of those authors who have been heavily involved, early experiments on the recognition heuristic that were run decades ago, but thus far never published, as well as new experimental tests of the recognition heuristic and alternative approaches. Finally, in the second issue, we will also provide a discussion of all papers in the two issues, and speculate about what we should possibly learn from these papers.

In allocating accepted articles to the two issues, we strove to strike a balance between the order of submission, the order of acceptance, and the topical fit of the papers. We apologize to those authors who feel disfavored by our attempts to establish such a balance; either because they preferred to see their contributions appear in the first, or alternatively, in the second issue.

Also surprising to Decision Science News was that although the topic was recognition processes in inference, all the articles address one particular rule of thumb, Goldstein & Gigerenzer’s recognition heuristic.

Goldstein, D. G. & Gigerenzer, G. (2002). Models of ecological rationality: The recognition heuristic. Psychological Review, 109, 75-90. [Download]

In other RH news, editor Marewski et al has a 2010 paper on the heuristic and editor Pohl also has a 2010 recognition heuristic paper.

CONTENTS OF THE FIRST SPECIAL ISSUE

Recognition-based judgments and decisions: Introduction to the special issue (Vol. 1), pp. 207-215 (html). Julian N. Marewski, Rüdiger F. Pohl and Oliver Vitouch

Why recognition is rational: Optimality results on single-variable decision rules, pp. 216-229 (html). Clintin P. Davis-Stober, Jason Dana and David V. Budescu

When less is more in the recognition heuristic, pp. 230-243 (html). Michael Smithson

The less-is-more effect: Predictions and tests, pp. 244-257 (html). Konstantinos V. Katsikopoulos

Less-is-more effects without the recognition heuristic, pp. 258-271 (html). C. Philip Beaman, Philip T. Smith, Caren A. Frosch and Rachel McCloy

Precise models deserve precise measures: A methodological dissection, pp. 272-284 (html). Benjamin E. Hilbig

Physiological arousal in processing recognition information: Ignoring or integrating cognitive cues?, pp. 285-299 (html). Guy Hochman, Shahar Ayal and Andreas Glöckner

Think or blink — is the recognition heuristic an intuitive strategy?, pp. 300-309 (html). Benjamin E. Hilbig, Sabine G. Scholl and Rüdiger F. Pohl

I like what I know: Is recognition a non-compensatory determiner of consumer choice?, pp. 310-325 (html). Onvara Oeusoonthornwattana and David R. Shanks

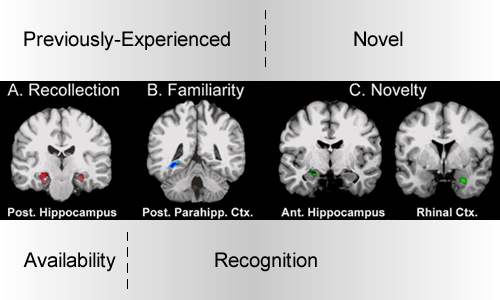
Photo adapted from S. M. Daselaar, M. S. Fleck, and R. Cabeza. (2006) Triple Dissociation in the Medial Temporal Lobes: Recollection, Familiarity, and Novelty. Journal of Neurophysiology 96, 1902-1911.

July 23, 2010

The counterfactual GPS!

Filed in Gossip ,Ideas ,R ,Tools
Subscribe to Decision Science News by Email (one email per week, easy unsubscribe)
WHAT IF YOUR GPS TOLD YOU WHAT WOULD HAVE HAPPENED IF YOU HAD TAKEN THE OTHER ROUTE?

Not long ago, your Decision Science News editor was planning a trip to a book group meeting along with another member. The monthly book group takes place in Cove Neck Long Island, about an hour East of Manhattan. Given the starting point (see map), the two had an email exchange about the best route. Your editor preferred to take the Southern route (above), as suggested by multiple Web sites, which gave time estimates under average conditions as well as under heavy traffic. These sites suggested that under the worst possible traffic, the trip would take as long as 1 hour 30 minutes.

However, the driver, citing “30 years of New York driving experience”, expressed certainty that going up the West Side Highway and taking the Kennedy (nee Triborough) bridge would be fastest. Your editor did not bring up his three years of daily commuting from the West Village to Long Island and went along for the ride, for which he was, and is, very thankful. Even if the northern route is longer, he reasoned, there will that much more of the driver’s delightful company to enjoy.

As the reader might expect, the northern route took about 2 hours and 15 minutes, possibly the longest voyage from the Tribeca to the North Shore since the advent of the canoe.

But that is all just background.

During the trip, your editor thought, “wouldn’t it be interesting to have a GPS that would show you where you are on the path you have chosen, but also show you where you would be had you chosen another path. A counterfactual GPS!”

But how would this fanciful counterfactual GPS know how long it would take you on the other route? Assuming some kind of large-scale participatory program, all GPSes could send back anonymous information about where they are and how fast they are going. In essence, the counterfactual GPS could just pick a car that is taking the other route, follow it on the other path, and display its position on your GPS, complete with nagging message (as above). It is not unlike choosing a person in another line at the grocery store to see what would have happened if you did not choose the line you did.

And what if nobody else is going to the same destination? Not a problem. Once the ‘followed’ car turns off the route, the counterfactual GPS picks another car to follow.

And what if you feel that you can drive faster than some random car that is traveling on the other route? Not a problem, the counterfactual GPS can sample all the cars traveling a piece of the route and pick one whose speed relative to other cars on its route is the same as your observed speed relative to other cars on your route.

And what if hardly anybody is driving at all when you are traveling? Again, not a problem. As soon as you indicate the two routes, the counterfactual GPS will start collecting statistics on both of them, in order to form up-to-the-minute estimates of how fast traffic is moving on each stretch of the route.

A counterfactual GPS would be more fun than educational, but it could improve the decision making of those who use it. That is, it could teach you whether it is a good idea or a bad idea to ignore the advice of the GPS.

When this was brought up at one of the famous and daily Yahoo Research lunches, Sharad begged to differ, saying that such a device would cause people to persist in their false belief that they are better at route planning than GPSes. Sharad reasoned (and he may correct us if we are wrong) that if the GPS is correct 60% of the times you disagreed with it, then it may be a long time before you realize that it is right more often than you are, and that your coincidental lucky streaks of beating it on occasion would only serve to make you think that you’ve identified special instances in which you have privileged information (even though such instances may be purely due to chance). In short, the counterfactual GPS could induce one to overfit the situation and engage in “probability matching” (deciding to trust the GPS 60% of the time) instead of always trusting it (the quote rational unquote thing to do).

Your editor supposes that if the counterfactual GPS kept long-term statistics, and then used onboard copies of R and ggplot2 to render and email out reports, such reports could help these people who are not good at trial-by-trial learning.

Like Sharad, your editor feels that people would be much more often right than wrong by trusting GPSes or mapping software. However, still, in 2010, there is information that can be profitably exploited, and with enough feedback, people might be able to outperform the GPS. For instance, if one sees an oil tanker on its side on the suggested route, it is likely that the GPS doesn’t know about this, making it is a good idea to go another way. (Sharad says in such cases, everyone will seek a detour, so staying put may be wisest).

What do you think, dear Decision Science News readers?

Would a counterfactual GPS make people better decision makers because it can teach people when and when not to trust the GPS? Or would it not make people better decision makers because it would encourage folks to believe they can eventually outsmart it (just as many people believe they’ll eventually outsmart the craps table or the stock market)?

July 13, 2010

iStalk and Stalkberry?

Filed in Gossip ,Ideas ,Tools
Subscribe to Decision Science News by Email (one email per week, easy unsubscribe)
SMARTPHONE UPLOADED PHOTOS AND VIDEOS REVEAL YOUR LOCATION BY DEFAULT

It wouldn’t be 2010 if people didn’t love going out, taking pictures with their iPhones and Blackberries and posting them online. It is not only a great way let your friends know what you are up to, it is a great way to unknowingly reveal your location and even home address to complete strangers.

Here’s how it goes down:

  1. You take a picture or video on your iPhone, Blackberry, or smart phone
  2. You phone adds your latitude and longitude to the photo by default (through its built in GPS)
  3. You upload the photo to the Web
  4. You add useful tags to the photo, saying it it is your home, etc
  5. Anyone who sees the photo can extract the latitude and longitude information from the photo
  6. You’ve got a stalker

Annoyingly, the addition of geographic information to your photos is usually tough to switch off without completely switching off the otherwise useful GPS on your phone. It’s a case of dumb defaults where smart defaults are in order.

ICanStalkU.com, which went live in May, is designed to raise awareness of the privacy risks of geo-tagged images. The software behind the site looks for location data in images shared on Twitter. It then runs that data through Geonames, an online service that finds place names associated with latitude and longitude coordinates. The result is a stream of messages that identify the current location of Twitter users.

By tracking images posted on Twitter by a single user it is also possible to plot that user’s movements on a map, say Ben Jackson and Larry Pesce, security consultants based in Boston and Providence, Rhode Island, respectively, and the creators of the site. Jackson says he will unveil this mapping tool next week at the Hackers on Planet Earth conference in New York.

That slightly paranoid feeling one gets when posting content to the Web is now justified. It’s a bit of victory for the intuitive decision maker in all of us that resisting sharing private information when social networks were new, but has since been ignored.

References

Geo-tags reveal celeb secrets

icanstalku.com

A better way to set defaults: Nudge Your Customers Toward Better Choices

Other Decision Science News posts on defaults.

ADDENDUM:

One bit of relief is that Facebook strips EXIF data from photos that get uploaded.

Tweet and location data faked. Maximum likelihood location of such a tweet is estimated to be 41.789841,-87.588823

July 7, 2010

Navigate the Bermuda Triangle of Mediation Analysis

Filed in Articles ,Encyclopedia ,Ideas ,R ,Research News
Subscribe to Decision Science News by Email (one email per week, easy unsubscribe)

MYTHS AND TRUTHS ABOUT AN OFTEN-USED, LITTLE-UNDERSTOOD STATISTICAL PROCEDURE

If you go to a consumer research conference, you will hear tales of how experiments have undergone particular statistical rites: the attainment of the elusive crossover interaction, the demonstration of full mediation through Baron and Kenny’s sacred procedure, and so on. DSN has nothing against any of these ideas, but is opposed to subjecting all ideas to the same experimental designs, to the same tests, the same alternative hypotheses (typically a null of no difference), and the same rituals.

Zhao, Lynch, and Chen point out in their recent Journal of Consumer Research article that Baron & Kenny’s Mediation Analysis is incredibly popular (ca 13,000 cites between 1986 and 2010), prescribed reflexively, though flawed in ways its users probably aren’t aware of. This article was invited by the journal “to serve as a tutorial on the state of the art in mediation analysis”.

ABSTRACT
Baron and Kenny’s procedure for determining if an independent variable affects a dependent variable through some mediator is so well known that it is used by authors and requested by reviewers almost reflexively. Many research projects have been terminated early in a research program or later in the review process because the data did not conform to Baron and Kenny’s criteria, impeding theoretical development. While the technical literature has disputed some of Baron and Kenny’s tests, this literature has not diffused to practicing researchers. We present a nontechnical summary of the flaws in the Baron and Kenny logic, some of which have not been previously noted. We provide a decision tree and a step-by-step procedure for testing mediation, classifying its type, and interpreting the implications of findings for theory building and future research.

REFERENCES
Baron, Reuben M. and David A. Kenny (1986), Moderator-Mediator Variables Distinction in Social Psychological Research: Conceptual, Strategic, and Statistical Considerations, Journal of Personality and Social Psychology, 51(6), 1173–82.

Bullock, J. G., Green, D. P, & Ha, S. E. (2010). Yes, But What’s the Mechanism? (Don’t Expect an Easy Answer), Journal of Personality and Social Psychology, Vol. 98, No. 4, 550–558.

Zhao, X., Lynch, J. G., Chen, Q. (2010).Reconsidering Baron and Kenny: Myths and Truths about Mediation Analysis. Journal of Consumer Research, 37, 197-206.

R Package for Causal Mediation Analysis

SPSS Code (see the Zhao, Lynch, and Chen article)

July 1, 2010

Maps without map packages

Filed in Ideas ,R
Subscribe to Decision Science News by Email (one email per week, easy unsubscribe)

LATITUDE + LONGITUDE + OVERPLOTTING FIX = MAPS

Decision Science News is always learning stuff from colleague, physicist, mathlete, and all-around computer whiz Jake Hofman.

Today, it was a quick and clean way to make nice maps in R without using any map packages: just plot the latitude and longitude of your data points (e.g. web site visitors) along with the “alpha” parameter to allow for layering of coincident points. It’s duh in hindsight.

Above we see a how it looks with a little data. Below is the result with more data and a lower alpha:

In the words of James Taylor, all you have to do is call:

library(ggplot2)
qplot(long,lat,data=us,alpha=I(.1))

To get the Decision-Science-News-approved framing and aspect ratio for the USA:

qplot(long,lat,data=wtd,alpha=I(.1),
xlim=c(-125-10/2,-65),ylim=c(23.5,50.5)) +
opts(aspect.ratio = 3.5/5)

As we are certain that there are readers who will want to show that there are much nicer ways to do this, we say: download the data and show us.

June 24, 2010

Oxytocin and defensiveness

Filed in Articles ,Encyclopedia ,Research News
Subscribe to Decision Science News by Email (one email per week, easy unsubscribe)

HORMONE LINKED TO IN-GROUP GOODNESS, OUT-GROUP BADNESS

Who doesn’t like oxytocin? Who could dislike any substance referred to as a cuddle chemical? The answer may be you, if you are not in with the crowd feeling the effects of the hormone.

Carsten de Dreu and a super-long list of co-authors (listed below), have administered oxytocin to experimental participants and validated its bright side (cooperation among people in a group), but uncovered its dark side (defensive aggression towards people in other groups). Read all about it.

CITATION
Carsten K. W. De Dreu, Lindred L. Greer, Michel J. J. Handgraaf, Shaul Shalvi, Gerben A. Van Kleef, Matthijs Baas,Femke S. Ten Velden, Eric Van Dijk, Sander W. W. Feith. (2010) The Neuropeptide Oxytocin Regulates Parochial Altruism in Intergroup Conflict Among Humans. Science, 328(5984), 1408 – 1411.

ABSTRACT
Humans regulate intergroup conflict through parochial altruism; they self-sacrifice to contribute to in-group welfare and to aggress against competing out-groups. Parochial altruism has distinct survival functions, and the brain may have evolved to sustain and promote in-group cohesion and effectiveness and to ward off threatening out-groups. Here, we have linked oxytocin, a neuropeptide produced in the hypothalamus, to the regulation of intergroup conflict. In three experiments using double-blind placebo-controlled designs, male participants self-administered oxytocin or placebo and made decisions with financial consequences to themselves, their in-group, and a competing out-group. Results showed that oxytocin drives a “tend and defend” response in that it promoted in-group trust and cooperation, and defensive, but not offensive, aggression toward competing out-groups.

H/T author Michel Handgraaf
Photo credit 1: http://en.wikipedia.org/wiki/File:Oxytocin_with_labels.png
Photo credit 2: http://www.flickr.com/photos/markusschoepke/305865244/

June 18, 2010

What’s your planner score?

Filed in Articles ,Encyclopedia ,Ideas ,Research News
Subscribe to Decision Science News by Email (one email per week, easy unsubscribe)
QUIZ YOUR LOVED ONES ABOUT THEIR PROPENSITY TO PLAN

John Lynch, Richard Netemeyer, Stephen Spiller, Alessandra Zammit have recently published in the Journal of Consumer Research this article on the propensity to plan and financial well being

ABSTRACT

Planning has pronounced effects on consumer behavior and intertemporal choice. We develop a six-item scale measuring individual differences in propensity to plan that can be adapted to different domains and used to compare planning across domains and time horizons. Adaptations tailored to planning time and money in the short run and long run each show strong evidence of reliability and validity. We find that propensity to plan is moderately domain-specific. Scale measures and actual planning measures show that for time, people plan much more for the short run than the long run; for money, short- and long-run planning differ less. Time and money adaptations of our scale exhibit sharp differences in nomological
correlates; short-run and long-run adaptations differ less. Domain-specific adaptations predict frequency of actual planning in their respective domains. A “very long-run” money adaptation predicts FICO credit scores; low planners thus face materially higher cost of credit.

And while reading the article is fun, it’s also a hoot to take the propensity to plan test yourself, and give it to your friends and family. Give it a whirl, see if it accords with their behavior. Here are the items. Feel free to post your score in the comments.

For each question, answer on a scale from 1 to 6 in which 1 means “I strongly disagree” and 6 means “I strongly agree.”
Propensity to Plan for Money—Short Run:
1. I set financial goals for the next few days for what I
want to achieve with my money.
2. I decide beforehand how my money will be used in
the next few days.
3. I actively consider the steps I need to take to stick to
my budget in the next few days.
4. I consult my budget to see how much money I have
left for the next few days.
5. I like to look to my budget for the next few days in
order to get a better view of my spending in the future.
6. It makes me feel better to have my finances planned
out in the next few days.

Propensity to Plan for Money—Long Run:
1. I set financial goals for the next 1–2 months for what
I want to achieve with my money.
2. I decide beforehand how my money will be used in
the next 1–2 months.
3. I actively consider the steps I need to take to stick to
my budget in the next 1–2 months.
4. I consult my budget to see how much money I have
left for the next 1–2 months.
5. I like to look to my budget for the next 1–2 months
in order to get a better view of my spending in the
future.
6. It makes me feel better to have my finances planned
out in the next 1–2 months.

Propensity to Plan for Time—Short Run:
1. I set goals for the next few days for what I want to
achieve with my time.
2. I decide beforehand how my time will be used in the
next few days.
3. I actively consider the steps I need to take to stick to
my time schedule the next few days.
4. I consult my planner to see how much time I have left
for the next few days.
5. I like to look to my planner for the next few days in
order to get a better view of using my time in the
future.
6. It makes me feel better to have my time planned out
in the next few days.

Propensity to Plan for Time—Long Run:
1. I set goals for the next 1–2 months for what I want
to achieve with my time.
2. I decide beforehand how my time will be used in the
next 1–2 months.
3. I actively consider the steps I need to take to stick to
my time schedule in the next 1–2 months.
4. I consult my planner to see how much time I have left
for the next 1–2 months.
5. I like to look to my planner for the next 1–2 months
in order to get a better view of using my time in the
future.
6. It makes me feel better to have my time planned out
in the next 1–2 months.

ARTICLE TEXT [Download]

MEDIA MENTIONS
Wall Street Journal: http://jcr.wisc.edu/publicity/authors/docs/SUNJ.AA.1A020.A1.361Z2009.pdf

Yahoo Finance: http://finance.yahoo.com/retirement/article/109540/fast-track-to-financial-success

Decision Science News (meta-reference): http://www.decisionsciencenews.com/2010/06/18/the-propensity-to-plan-is-good-for-your-wallet/