Stadium / home team effects in making field goals
DOES IT MATTER WHERE IT IS KICKED? ANALYSIS OF OVER 10,000 ATTEMPTS
Click to enlarge
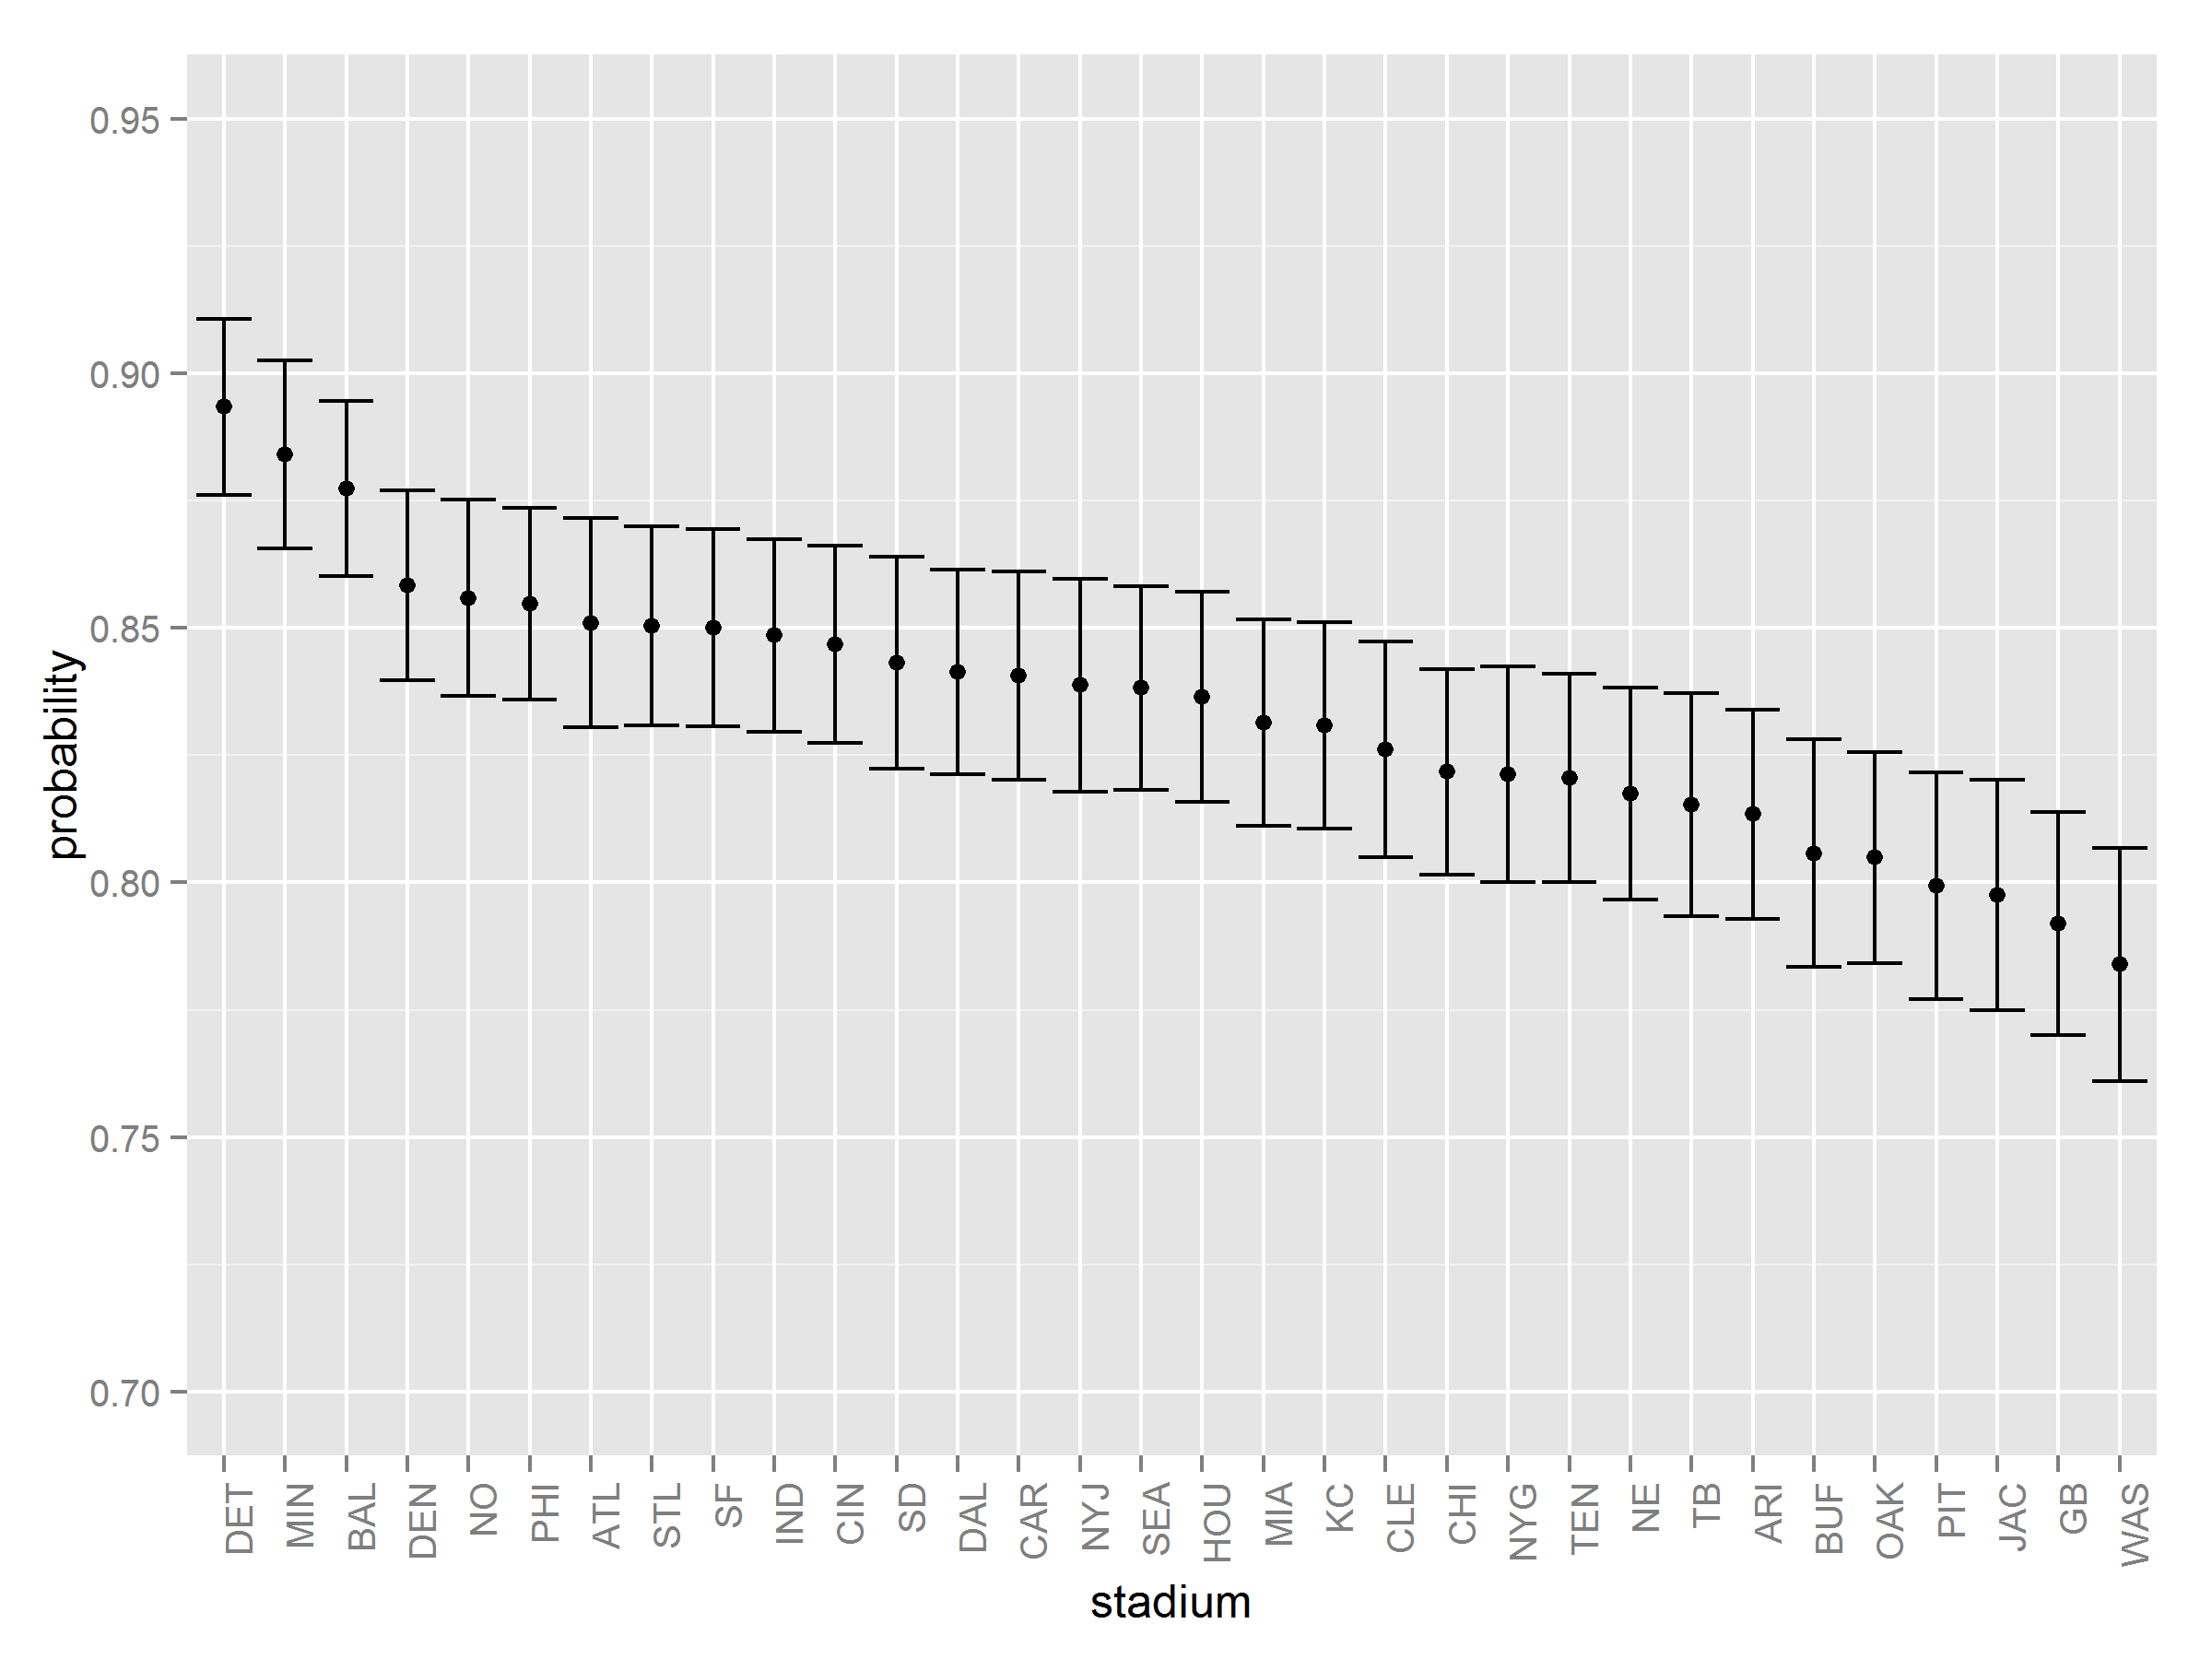
In our third of not one, not two, but three posts on kicking a football in the NFL, we take on a reader question of whether the stadium / home team matters for making a field goal. We pulled up the data on every field goal since 2002 (over 10,000) of them and plotted the probability of scoring as a function of the stadium in which the field goal was kicked. The results are above. Bars are +/- 1 standard error.
Is it a statistically significant effect? Apparently so:
Pearson's Chi-squared test
X-squared = 49.9556, df = 31, p-value = 0.01693
ADDENDUM 1
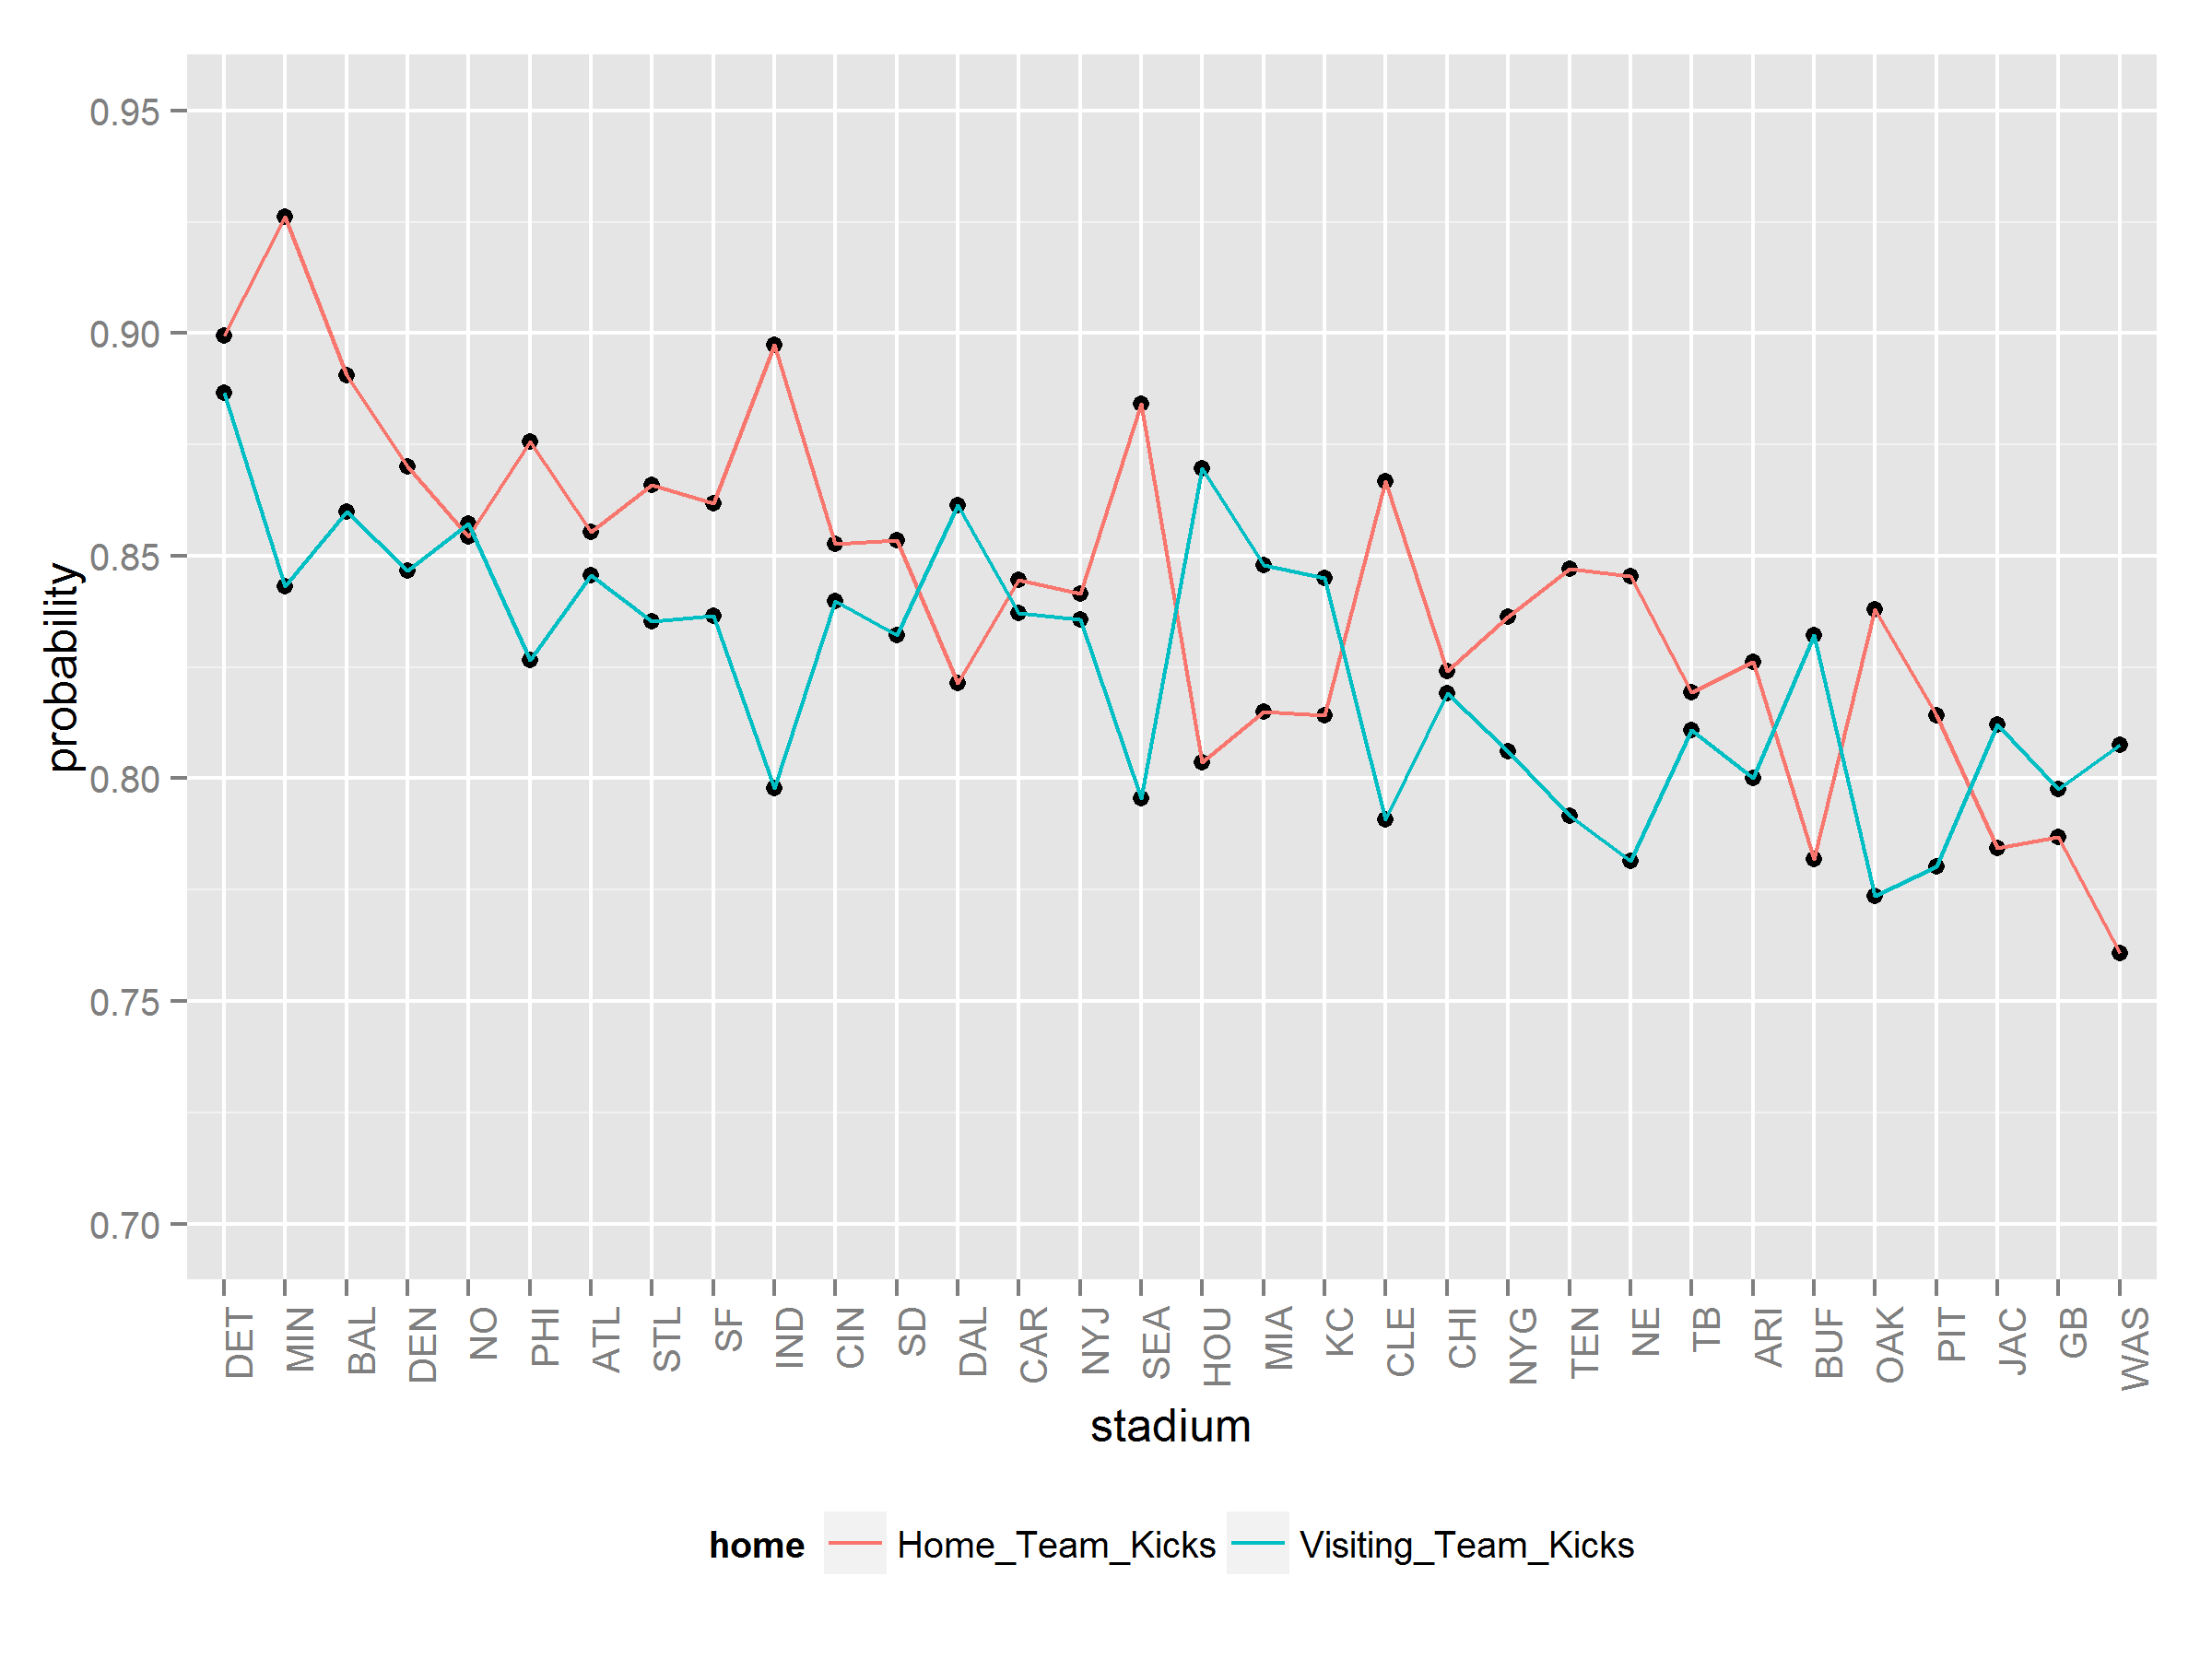
We had a request to see the broken down by home team or visiting team kicking. Here you go:
Click to enlarge
ADDENDUM 2:
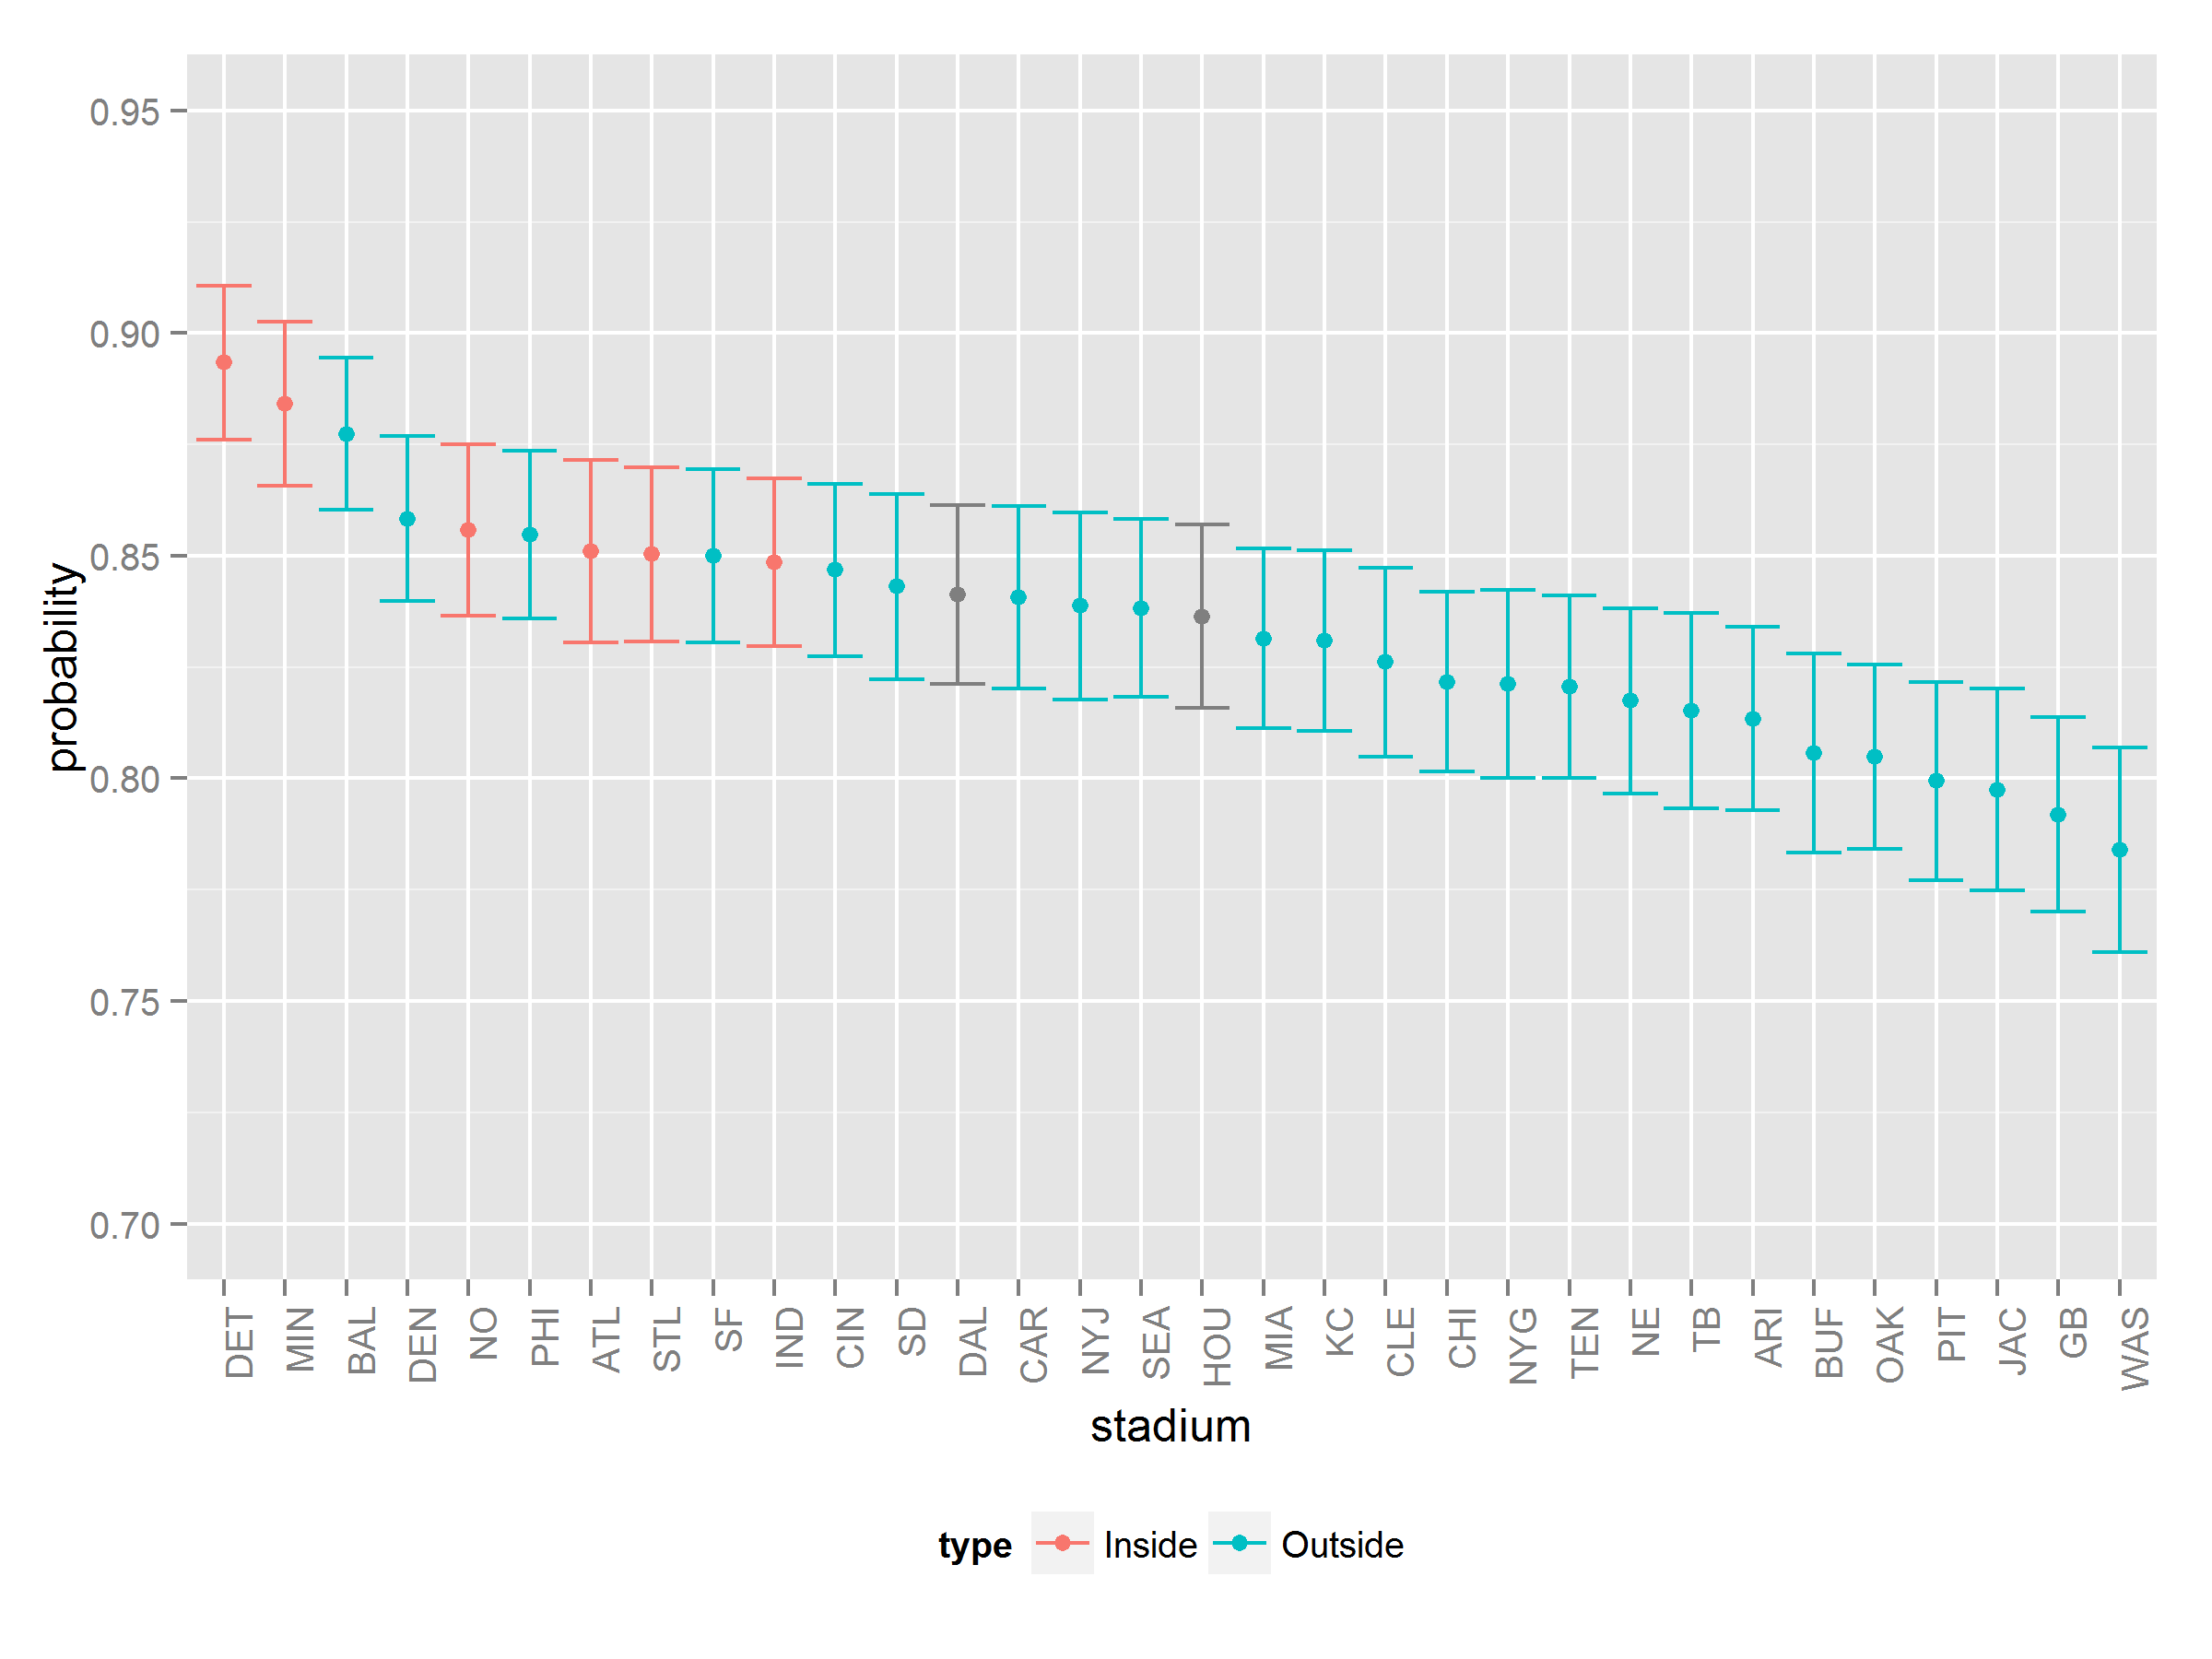
Owing to the generosity of the great reader / Scottish economist Adam Smith (see comments), we now have the stadiums broken down by door (indoor or outdoor). The gray stadiums are either convertible (Houston) or have a small hole in the roof (Dallas).
Correlation is not causation, but it sure does seem plausible that having an indoor stadium helps the kicker.
Click to enlarge
APPENDIX
To decode the team names, use this list:
ARI: Arizona Cardinals
ATL: Atlanta Falcons
BAL: Baltimore Ravens
BUF: Buffalo Bills
CAR: Carolina Panthers
CHI: Chicago Bears
CIN: Cincinnati Bengals
CLE: Cleveland Browns
DAL: Dallas Cowboys
DEN: Denver Broncos
DET: Detroit Lions
GB: Green Bay Packers
HOU: Houston Texans
IND: Indianapolis Colts
JAX: Jacksonville Jaguars
KC: Kansas City Chiefs
MIA: Miami Dolphins
MIN: Minnesota Vikings
NE: New England Patriots
NO: New Orleans Saints
NYG: New York Giants
NYJ: New York Jets
OAK: Oakland Raiders
PHI: Philadelphia Eagles
PIT: Pittsburgh Steelers
SD: San Diego Chargers
SEA: Seattle Seahawks
SF: San Francisco 49ers
STL: Saint Louis Rams
TB: Tampa Bay Buccaneers
TEN Tennessee Titans
WAS: Washington Redskins
Figure 1 Data:
Stadium   Miss Hit
ARI         67 292
ATL         45 257
BAL         45 322
BUF         61 253
CAR         51 269
CHI         64 295
CIN         53 293
CLE         56 266
DAL         53 281
DEN         50 303
DET         34 285
GB          72 274
HOU         53 271
IND         55 308
JAC         64 252
KC          58 285
MIA         58 286
MIN         35 267
NE          63 282
NO          48 285
NYG         59 271
NYJ         50 260
OAK         72 297
PHI         51 300
PIT         65 259
SD          48 258
SEA         55 285
SF          51 289
STL         50 284
TB          58 256
TEN         63 288
WAS         70 254
Figure 2 Data:
ARI     Home_Team_Kicks         32 152
        Visiting_Team_Kicks     35 140
ATL     Home_Team_Kicks         24 142
        Visiting_Team_Kicks     21 115
BAL     Home_Team_Kicks         23 187
        Visiting_Team_Kicks     22 135
BUF     Home_Team_Kicks         36 129
        Visiting_Team_Kicks     25 124
CAR     Home_Team_Kicks         23 125
        Visiting_Team_Kicks     28 144
CHI     Home_Team_Kicks         32 150
        Visiting_Team_Kicks     32 145
CIN     Home_Team_Kicks         28 162
        Visiting_Team_Kicks     25 131
CLE     Home_Team_Kicks         20 130
        Visiting_Team_Kicks     36 136
DAL     Home_Team_Kicks         30 138
        Visiting_Team_Kicks     23 143
DEN     Home_Team_Kicks         23 154
        Visiting_Team_Kicks     27 149
DET     Home_Team_Kicks         17 152
        Visiting_Team_Kicks     17 133
GB      Home_Team_Kicks         39 144
        Visiting_Team_Kicks     33 130
HOU     Home_Team_Kicks         32 131
        Visiting_Team_Kicks     21 140
IND     Home_Team_Kicks         19 166
        Visiting_Team_Kicks     36 142
JAC     Home_Team_Kicks         36 131
        Visiting_Team_Kicks     28 121
KC      Home_Team_Kicks         29 127
        Visiting_Team_Kicks     29 158
MIA     Home_Team_Kicks         32 141
        Visiting_Team_Kicks     26 145
MIN     Home_Team_Kicks         11 138
        Visiting_Team_Kicks     24 129
NE      Home_Team_Kicks         30 164
        Visiting_Team_Kicks     33 118
NO      Home_Team_Kicks         22 129
        Visiting_Team_Kicks     26 156
NYG     Home_Team_Kicks         27 138
        Visiting_Team_Kicks     32 133
NYJ     Home_Team_Kicks         26 138
        Visiting_Team_Kicks     24 122
OAK     Home_Team_Kicks         29 150
        Visiting_Team_Kicks     43 147
PHI     Home_Team_Kicks         25 176
        Visiting_Team_Kicks     26 124
PIT     Home_Team_Kicks         34 149
        Visiting_Team_Kicks     31 110
SD      Home_Team_Kicks         23 134
        Visiting_Team_Kicks     25 124
SEA     Home_Team_Kicks         19 145
        Visiting_Team_Kicks     36 140
SF      Home_Team_Kicks         25 156
        Visiting_Team_Kicks     26 133
STL     Home_Team_Kicks         22 142
        Visiting_Team_Kicks     28 142
TB      Home_Team_Kicks         30 136
        Visiting_Team_Kicks     28 120
TEN     Home_Team_Kicks         28 155
        Visiting_Team_Kicks     35 133
WAS     Home_Team_Kicks         39 124
        Visiting_Team_Kicks     31 130
Figure 3 Data: See Figure 1 data plus the comments
Graphs were made in R using Hadley Wickham’s ggplot2 package. Pointer to the data can be found at our previous post.

Stadium In/Out
ARI Out
ATL In
BAL Out
BUF Out
CAR Out
CHI Out
CIN Out
CLE Out
DAL mostly In (weird hole in roof)
DEN Out
DET In
GB Out
HOU In/out (retractable roof); no log of roof status available
IND In
JAC Out
KC Out
MIA Out
MIN In
NE Out
NO In
NYG Out
NYJ Out
OAK Out
PHI Out
PIT Out
SD Out (but it is San Diego!)
SEA Open
SF Open
STL In
TB Out
TEN Out
WAS Out
February 13, 2013 @ 2:58 pm
Sorry, I mean “In” for SEA and SF
February 13, 2013 @ 2:59 pm
Crap, make that “Out” for SEA and SF… Third time, right?
February 13, 2013 @ 2:59 pm
Are these conditionalized on distance? If not, then would the rational approach be for coaches in ‘good’ stadiums to go for longer kicks (and shorter kicks in ‘bad’ stadiums), so that all venues approach the same success rate?
February 14, 2013 @ 9:11 am
Hi Rob,
I could condition on distance in a regression model (though it would be hard to make pretty graphs from the result :). My prior is that this won’t matter much since, in general, the home and visiting teams tend to have rather correlated performance in a given stadium.
February 14, 2013 @ 9:15 am
One remark. Seemingly, with Tukey’s hsd test, only DET and WAS are found different (by Matlab, with P-value of 0.04). The rest of the Stadium are not different, with alpha 0.1.
February 14, 2013 @ 9:46 am
jr – I’d believe that. For the novice readers I should mention that there’s no contradiction implied by finding a variable to be significant when no pair is significant in a post hoc test.
February 14, 2013 @ 10:06 am
Hey Dan,
Since teams tend to have the same kicker across multiple years, could kicker-effects be driving the result? It could even be that some teams consistently attempt shorter/longer field goals (which is something you could control for). There’s probably even some persistence in visiting teams’ kicking performance because each team plays 6 division games each year against the same three teams.
February 15, 2013 @ 2:51 pm