NEW PAPER, NEW PRODUCT FEATURE USING PERSPECTIVE PHRASES
Click to enlarge
As mentioned a few times in past posts, we’ve been doing research on how “perspective sentences,” for example “Israel is about the size of New Jersey in area and population” helps Americans comprehend measurements beyond simply saying “Israel has an area of 20,770 square kilometers and a population of 8,793,000.” We’re happy to say that, due to the drive of Jake Hofman and others, this research has now been incorporated into Bing search engine results:
Chris Riederer, Jake Hofman and I have just published a new paper on this topic which will be presented at CHI 2018. In it, we propose and test methods for generating perspectives. For example, why do we feel that “roughly the population of California” is better than “roughly 10 times the population of Oklahoma,” even though they’re about equally accurate and even if the person you are talking to is from Oklahoma? It turns out that 10x not an ideal multiplier for people to work with (strange, we know) and Oklahoma is not ideal to use in examples.
Christopher Riederer, Jake M. Hofman and Daniel G. Goldstein. (2018). To put that in perspective: Generating analogies that make numbers easier to understand. In Proceedings of the 2018 ACM Conference on Human Factors in Computing Systems (CHI’18)
In the course of doing this research, we were able to generate some fun charts like the one at the top of the post. People underestimate the areas of pretty much all US states (above, top panel) but are especially bad at central and Western states. Furthermore, they underestimate the populations of Eastern states (above, bottom panel). The US is tricky for geographic inferences because many big states have small populations. This makes traditional election maps deceptive and have led to some (weird, we know) ways of rescaling them. [BTW, if you are interested in the psychology of demographic estimation, we can recommend Brown and Siegler (1993)].
Another thing we found is that people do a lot better estimating things when you give them a perspective sentence to help them (e.g., “The population of Poland is about as big as that of California. What is Poland’s population?”). The left chart below shows the improvement in area estimation (note that they still underestimate areas, even with hints) and the right chart shows improvement in population estimation. Click the chart to enlarge it.
Click to enlarge
If you’d like to read more, here are some popular articles on the research:
Here are some of the people who have worked on the research side of this project:
APPLICATION DEADLINE MARCH 12, 2018

The 2018 Summer Institute on Bounded Rationality will take place on June 19 – 27, 2018, at the Max Planck Institute for Human Development in Berlin, Germany. The Summer Institute brings together talented young researchers and renowned scientists from around the globe and aims to spark a dialogue about decision-making under the real world constraints of limited time, information, or computational power.
It offers a forum for young scholars from various disciplines to share their approaches, discuss their research, and to inspire each other. The program will cover the fundamentals, methodology, and recent findings on bounded rationality. This year’s Summer Institute returns to its roots by focusing on how intelligent behavior arises from the interaction between of the structure of the environment combined with cognitive strategies used by the organism.The keynote address will be given by Ulrike Hahn, Professor at Birkbeck, University of London.
On behalf of the directors of the Summer Institute, Gerd Gigerenzer and Ralph Hertwig, we invite young decision-making scholars from all fields to apply.
Participation will be free, accommodation will be provided, and travel expenses will be partly reimbursed.
Applications are open until March 12, 2018.
Apply here: http://bit.ly/2npmmNT
Website: http://bit.ly/2DPGYcu
EXPERIENCE THE BINOMIAL AND NORMAL DISTRIBUTIONS
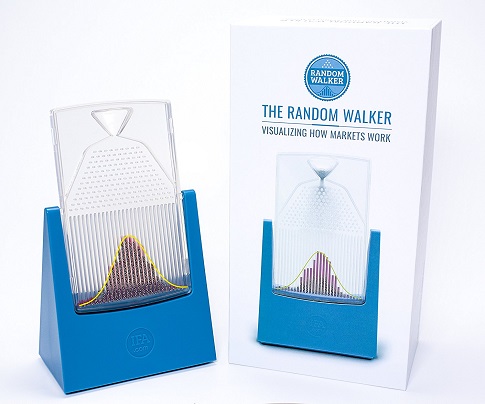
The Random Walker is an inexpensive mini quincunx
Every since taking Stephen M. Stigler’s class on the history of statistics at Chicago, we’ve been wanting to get our hands on a quincunx.
A quincunx, also referred to as a Galton Board or bean machine (*) is one of these, which you may have seen in a science museum:

Balls are released from the top and bounce off of the pins. Assume the ball goes left or right with equal probability at each bound. By the time they get to the bottom you’ll see that relatively few balls experience a series of exclusively left bounces or exclusively right bounces (the tails of the distribution) and most experience some mixture of left and right bounces and end up in towards the middle. The more equal the number of left and right bounces is, the closer the ball falls to the exact center. The balls are collected into bins and the count of balls in each bin should follow the binomial distribution. In one of the coolest moves math ever did, when the number of bins is large, the binomial distribution approximates the normal distribution.
Seeing this happen is a great way to teach probability without advanced notation. You can do it on paper by flipping a coin at each bounce, like I recently did with my 9 year old:
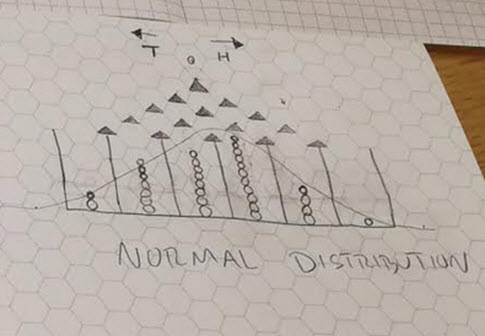
but that’s slow going. (If you do this, I recommend starting with a real coin then transitioning to the random.org smartphone app which flips coins quickly and easily. Boredom and frustration can cause the kid to lose interest before a pattern emerges).
In the past, when we’ve checked (and we’ve checked a lot) the cost of a quincunx was high. Hundreds or thousands of dollars.
But, as chance would have it, I stumbled across one on Twitter that turned out to be cheap. It’s called The Random Walker and was only $20 when we ordered it on Amazon.
(*) We don’t really like the name bean machine.
(**) We do really like LaPlace quote in the second photo. Before the modern day belief that minds don’t reason according to the theory of probability, it was thought that the theory of probability describes how minds reason.
HOW MANY GAMES WAS THAT?

AlphaZero is a reinforcement learning (RL) progam that can take a game like chess and given only the rules, can play games against itself and learn how to win.
According to several articles, it learned from scratch and surpassed human knowledge of chess in four hours. Specifically, it beat the leading chess computer in that time.
A friend of ours asked if it trained with more or less experience, in terms of games played, than a young human grandmaster has.
To look into this question, we read the paper.
About 30 people have become grandmasters before 15. Let’s overestimate and say they played 10 years or 3650 days and 100 games a day, that’s 365k games. From what I can tell, AlphaZero played about 20 million games at the point it beat a top rated chess engine called Stockfish (article, Table S3, noting it beat Stockfish at around 4 hours).
So it seems like AlphaZero needs more games to learn than a human grandmaster does. However, AlphaZero starts only with the rules and figures everything out from there. In contrast, people get coached and handed strategies which have been refined over millions of games. It makes sense that humans can learn from fewer games. Also RL systems explore patently ridiculous moves on the way to becoming good players and people can likely prune the space better. But on the other hand, the assumptions human bring to this pruning might be what causes us not to be as good at chess as AlphaZero.
Note that some say the real story here is that it taught itself not the four hours number, because of the serious difference in hardware between AlphaZero and Stockfish. Viswanathan Anand says on chessbase:
Obviously this four hour thing is not too relevant — though it’s a nice punchline — but it’s obviously very powerful hardware, so it’s equal to my laptop sitting for a couple of decades. I think the more relevant thing is that it figured everything out from scratch and that is scary and promising if you look at it…I would like to think that it should be a little bit harder. It feels annoying that you can work things out with just the rules of chess that quickly.
Photo credit:https://www.flickr.com/photos/mukumbura/4043364183/
Filed in
Programs
 Subscribe
 to Decision Science News by Email (one email per week, easy unsubscribe)
AT DUKE UNIVERSITY, APPLICATION DEADLINE FEBRUARY 19, 2018

From the evening of Sunday, June 17 to the morning of Saturday, June 30, 2018, the Russell Sage Foundation will sponsor the Summer Institute in Computational Social Science, to be held at Duke University. The purpose of the Summer Institute is to bring together graduate students, postdoctoral researchers, and beginning faculty interested in computational social science. The Summer Institute is for both social scientists (broadly conceived) and data scientists (broadly conceived). The co-organizers and principal faculty of the Summer Institute are Christopher Bail and Matthew Salganik.
The instructional program will involve lectures, group problem sets, and participant-led research projects. There will also be outside speakers who conduct computational social science research in academia, industry, and government. Topics covered include text as data, website scraping, digital field experiments, non-probability sampling, mass collaboration, and ethics. There will be ample opportunities for students to discuss their ideas and research with the organizers, other participants, and visiting speakers. Because we are committed to open and reproducible research, all materials created by faculty and students for the Summer Institute will be released open source.
Participation is restricted to Ph.D. students, postdoctoral researchers, and untenured faculty within 7 years of their Ph.D. Most participant costs during the workshop, including housing and most meals, will be covered, and most travel expenses will be reimbursed up to a set cap. About thirty participants will be invited. Participants with less experience with social science research will be expected to complete additional readings in advance of the Institute, and participants with less experience coding will be expected to complete a set of online learning modules on the R programming language. Students doing this preparatory work will be supported by a teaching assistant who will hold online office hours before the Institute.
Application materials should be received by Monday, February 19, 2018.
A COMPETITION FOR THE BEST IDEAS TO IMPROVE FINANCIAL SECURITY
Behavioral economists and financial services firms may be interested in The Financial Inclusion Challenge new competition.
Financial security is beyond the reach of millions of Americans. Nearly one-fourth of adults can’t pay their monthly bills, and roughly the same number have little or no access to a bank. Many have no retirement savings or aren’t sure how to manage them. Financial insecurity damps growth and prosperity in the consumer-driven U.S. economy.
The Wall Street Journal’s Financial Inclusion Challenge, sponsored by MetLife Foundation, is seeking entries from for-profit and nonprofit enterprises whose products or services help to improve financial resilience, via innovative, scalable, sustainable and socially positive solutions.
Enter the competition
Deadline: Noon ET, Friday, Feb. 23, 2018
Three finalists, selected by a panel of independent judges, will be announced March 19. The winner will be selected at a Wall Street Journal event the week of May 7.
The Financial Inclusion Challenge is part of a Wall Street Journal initiative to highlight Americans’ struggles in managing personal finances. A series of video reports and finalist profiles will be published on WSJ.com between January and May. The finalists will be invited to join the audience at D.LIVE, the Journal’s technology conference, Nov. 12-14, in Laguna Beach, Calif.
See the full competition rules
Send questions to financialinclusion@wsj.com
Filed in
Conferences
Subscribe to Decision Science News by Email (one email per week, easy unsubscribe)
DEADLINE SOON, BUT ONLY A SHORT ABSTRACT NEEDED

The 56th Edwards Bayesian Research Conference will be held March 1-3, 2018, on the campus of California State University, Fullerton.
Presentations at this conference may come from any area related to judgment and decision making and are NOT limited to Bayes theorem or Bayesian statistics.
Submissions are due by January 15, 2018.
We maintain certain traditions that have made these meetings so enjoyable. As Ward Edwards put it, “…the atmosphere is informal, the discussion can get intense, and many of the best debates take place during coffee breaks or in the hospitality suite at the end of the day. This conference is a good place to try out your latest, wildest set of ideas on a kindly, knowledgeable, and critical audience.”
Hotel rooms will be available at an excellent rate at the Fullerton Marriott, which is across the street from the meeting room.
Visit the conference website for more information
Questions can be sent to Daniel Cavagnaro: dcavagnaro@fullerton.edu
WINNERS GET TO BE CO-AUTHORS ON THE PAPER

Ori Plonsky, Reut Apel, Ido Erev, Eyal Ert, and Moshe Tennenholtz announce
You are invited to participate in the 2018 choice prediction competition (CPC18) for human decision making. The main goal of this competition is to improve our understanding of the ways by which behavioral decision research can contribute to the derivation of useful predictions of human decision making, above and beyond what is possible using data-driven machine learning tools (if at all possible).
CPC18 distinguishes between two very different prediction tasks: predicting the aggregate population behavior in an unfamiliar choice problem, and predicting the individual behavior in a familiar choice problem. Specifically, CPC18 includes two parallel competition tracks, and you are invited to participate in either one, or better yet, in both. A second goal of the competition is to then understand what type of models are better suited to handle each type of task.
The rules of the competition and further details are given in https://cpc18.wordpress.com. A white paper summarizing the current stage of the competition is provided here. The deadline for final submissions is May 12, 2018 (but for one of the tracks, a partial submission must be made by May 8th; see website for details). To compete, you are required to register by April 10th.
As in some of the previous choice prediction competitions, the prize for the winners is an invitation to be a co-author of the paper that summarizes the competition.
The competition’s basic idea is as follows. We previously collected a large dataset of human choices between monetary gambles, under risk and under ambiguity, with and without feedback. This dataset includes over 500,000 individual consequential choices. Almost all of this data is publicly available at https://zenodo.org/record/845873#.WeDg9GhSw2x, and can (and probably should) be used to develop and train your predictive models.
In those experiments, each decision maker faced many problems, and the two tracks differ with respect to the exact prediction challenge:
In the track Individual behavior, familiar problems the task is to predict the individual behavior of a small portion of these decision makers in some of the problems they faced. Therefore, a small portion of the data already collected will be used as the competition data in that track and is thus not available. The goal in this track is to predict, as accurately as possible, the individual behavior reflected in that data.
In the track Aggregate behavior, unfamiliar problems the task is to predict the aggregate choice rates in a new experiment with new problems that we will run (during March-April 2018). As in some of the previous choice prediction competitions, the submissions should be computer programs that read the parameters of the choice problems as input, and derive the predicted choice rates as output.
We hope that you are up for the challenge!
Photo credit: https://flic.kr/p/4jbFC8
Filed in
SJDM
Subscribe to Decision Science News by Email (one email per week, easy unsubscribe)
SOCIETY FOR JUDGMENT AND DECISION MAKING NEWSLETTER

The quarterly Society For Judgment and Decision Making newsletter is ready for download:
http://sjdm.org/newsletters/
BAGEL SHOP IDEA
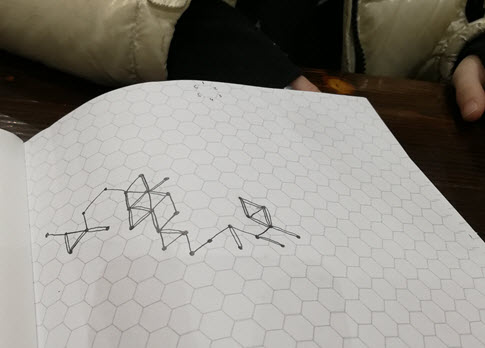
I was sitting in a bagel shop on Saturday with my 9 year old daughter. We had brought along hexagonal graph paper and a six sided die. We decided that we would choose a hexagon in the middle of the page and then roll the die to determine a direction:
1 up (North)
2 diagonal to the upper right (Northeast)
3 diagonal to the lower right (Southeast)
4 down (South)
5 diagonal to the lower left (Southwest)
6 diagonal to the upper left (Northwest)
Our first roll was a six so we drew a line to the hexagon northwest of where we started. That was the first “step.”
After a few rolls we found ourselves coming back along a path we had gone down before. We decided to draw a second line close to the first in those cases.
We did this about 50 times. The results are pictured above, along with kid hands for scale.
I sent the picture to my friend and serial co-author Jake Hofman because he likes a good kid’s science project and has a mental association for everything in applied math. He wrote “time for some Brownian motion?” and sent a talk he’d given a decade ago at a high school which taught me all kind of stuff I didn’t realize connecting random walks to Brownian motion, Einstein, the existence of atoms and binomial pricing trees in finance. (I was especially embarrassed not to have mentally connected random walks to binomial pricing because I had a slide on that in my job talk years ago and because it is the method we used in an early distribution builder paper.)
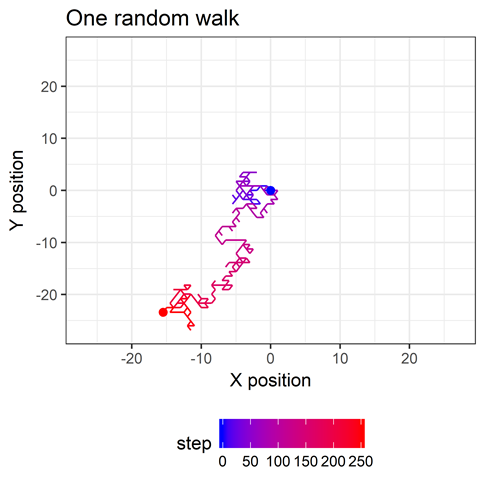
Back at home Jake did some simulations on random walks in one dimension (in which you just go forward or backward with equal probability) and sent them to me. Next, I did the same with hexagonal random walks (code at the end of this post). Here’s an image of one random walk on a hexagonal field.
I simulated 5000 random walks of 250 steps, starting at the point 0,0. The average X and Y position is 0 at each step, as shown here.
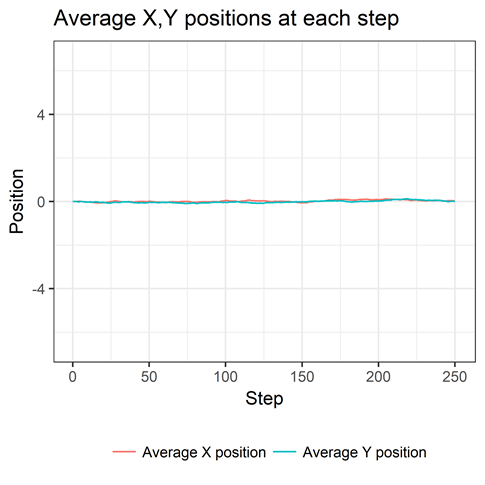
This might seem strange at first. But think about many walks of just one step. The number of one-step journeys in which your X position is increased a certain amount will be matched, in expectation, by an equal number of one-step journeys in which your X position is decreased by the same amount. Your average X position is thus 0 at the first step. Same is true for Y. The logic scales when you take two or more steps and that’s why we see the flat lines we do.
If you think about this wrongheadedly you’d think you weren’t getting anywhere. But of course you are. Let’s look at your average distance from the starting point at each step (below).

The longer you walk, the more distant from the starting point you tend to be. Because distances are positive, the average of those distances is positive. We say you “tend to” move away from the origin at each step, because that is what happens on average over many trips. At any given step on any given trip, you could move towards or away from the starting point with equal probability. This is deep stuff.
Speaking of deep stuff, you might notice that the relationship is pretty. Let’s zoom in.

The dashed line is the square root of the number of steps. It’s interesting to note that this square root relationship happens in a one-dimensional random walk as well. There’s a good explanation of it in this document. As Jake put it, it’s as if the average walk is covered by a circular plate whose area grows linearly with the number of steps. (Why linearly? Because area of a circle is proportional to its radius squared. Since the radius grows as the square root of the number of steps, the radius squared is linear in the number of steps)
(*) As a sidenote, I was at first seeing something that grew more slowly than the square root and couldn’t figure out what the relationship was. It turns out that the square root relationship holds for the root mean squared distance (the mean of the squared distances) and I had been looking at the mean Euclidean distance. It’s a useful reminder that the term “average” has quite a few definitions. “Average” is a useful term for getting the gist across, but can lead to some confusion.
Speaking of gists, here’s the R code. Thanks to @hadleywickham for creating the tidyverse and making everything awesome.
RCODE