The SJDM Newsletter is ready for download

SOCIETY FOR JUDGMENT AND DECISION MAKING NEWSLETTER
The quarterly Society for Judgment and Decision Making newsletter can be downloaded from the SJDM site:
Dan Goldstein
SJDM Newsletter Editor
SOCIETY FOR JUDGMENT AND DECISION MAKING NEWSLETTER
The quarterly Society for Judgment and Decision Making newsletter can be downloaded from the SJDM site:
Dan Goldstein
SJDM Newsletter Editor
LET’S PUT THAT INTO PERSPECTIVE
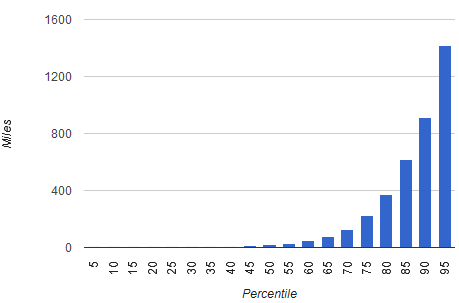
The NYT had a nice infographic entitled “The typical American lives only 18 miles from mom“. They’re saying the median distance to mom is 18 miles.
But when you look at the data in greater depth (thanks to the graph in the article, which we reproduce above), it looks like the mean distance is over 200 miles. That’s the crow-flies distance from DC to New York, a 4 hour drive sans traffic. You might say the median is the better statistic, and we agree: relatively few people living on the opposite coast from their parents drive the average up. However, the downside of the median is that it doesn’t let you appreciate how far from their parents a third of the country lives. In the spirit of putting numbers into perspective to improve comprehension, let’s put that into perspective. Values are rounded. Drive times are from online maps and do not include traffic delays or even a single pit stop.
When the miles are in familiar units, people live farther from mom than it first seems. Also, mentioned in the article,
… which also make the surprising stat seems less surprising.
CONFERENCE DATES MAY 21-23, 2017
Abstract Submission Deadline December 15, 2016
Submitting Abstracts
To submit an extended abstract (1 page single spaced pdf with author information), please visit the conference website
http://leeds.colorado.edu/event/bouldersummerconference#overview
and click on the Submit Paper Abstract link:
Conference Overview
The Boulder Summer Conference in Consumer Financial Decision Making, now in its 8th year, is the world’s foremost conference for discussion of interdisciplinary research on consumer financial decision-making. Consumer welfare is strongly affected by household financial decisions large and small: choosing mortgages; saving to fund college education or retirement; using credit cards to fund current consumption; choosing how to “decumulate” savings in retirement; deciding how to pay for health care and insurance; and investing in the stock market, managing debt in the face of financial distress. This conference brings together outstanding scholars from around the world in a unique interdisciplinary conversation with regulators, business people in financial services, and consumer advocates working on problems of consumer financial decision-making.
Our goal is to stimulate cross-disciplinary conversation and improve basic and applied research in the emerging area of consumer financial decision-making. This research can inform our understanding of how consumers actually make such decisions and how consumers can be helped to make better decisions by innovations in public policy, business, and consumer education. Please see the 2016, 2015, and 2014 programs on the conference website to see abstracts of research by scholars in economics, psychology, sociology, behavioral finance, consumer research, decision sciences, behavioral economics, and law. Our format allows a very high level of opportunity for conversation and interaction around the ideas presented.
Conference Format
We begin with a keynote session late Sunday afternoon about how consumer financial behavior is influenced by credit scoring and use of credit scores for non-lending purposes. The keynote session will be followed by a reception and poster session. Monday and Tuesday we have ten 75-minute sessions with two related papers from different disciplines, with discussion by an industry or government expert or a scholar from a third field. We begin with financial decision making of consumers in distress because of poor financial decision-making or situational stress. We then turn our focus to more basic processes that guide everyday consumer financial decision-making, both good and bad. Throughout the conference we schedule significant time for informal interaction outside of the sessions.
The conference program committee will select papers for presentation at the conference based on extended abstracts. Selected papers must not be published prior to the conference. Authors submitting an abstract must commit to have a paper that is complete and available for review by discussants one month prior to the conference. Selections will be based on quality, relevance to consumers’ financial decision-making, and contribution to breadth of topics and disciplinary approaches. We consider not just the individual merits of the papers, but how they pair with another submission from a scholar in a different field. The organizers will invite authors of the best papers not selected for presentation at a plenary session to present their work at the Sunday evening poster session.
Registering for the Conference and Booking a Room
There are links on the conference website for booking at the St. Julien Hotel and for registering for the conference.
The conference will be held in the St. Julien Hotel & Spa. We have negotiated very attractive room rates for conference attendees (and families). Please note that the Conference has not guaranteed any rooms, rather they are on a “first come” basis. We encourage you to book your rooms as soon as you can. Boulder is a popular summer destination and rooms go quickly at the St. Julien Hotel.
HERE IS WHAT YOU CAME UP WITH
The author’s daughter’s tool kit
A while back, Decision Science News put out a call on the Society for Judgment and Decision Making email list looking for “tools, methods to improve decision making, outcomes, and information communication / visualization”:
I’m interested in learning about tools and methods people in this community have created to improve decision making, decision outcomes, and information communication / visualization. It would be good to have examples of things that are a) finished, codified b) tested for effectiveness. Bonus points if they are field tested and/or tested for long-term retention
This would include things like:
* Training programs incl. games, videos, procedures, tutorials
* Decision aids, calculators
* Elicitation techniques (e.g. SPIES, …)
* Changes in information format (e.g. frequency formats, …)
* Policies, procedures (e.g. Save More Tomorrow, …)
* Feats of choice architecture (e.g., reordering, ….)To make the resulting list more useful to the community, it might be wise to structure your submissions like this:
Tool / method name:
One sentence description:
One sentence effectiveness test result:
Relevant cite(s):
Here are the responses we received. If you have more, put them in the comments, but please structure them as suggested above.
####################
DISTRIBUTION BUILDERS
These tools are similar to the Distribution Builder (*) tool for eliciting probability distributions
(*) Goldstein, Daniel G., Johnson, Eric J. & Sharpe, William F. (2008). Choosing outcomes versus choosing products: Consumer-focused retirement investment advice. Journal of Consumer Research, 35(3), 440-456.
Quentin Andre’s Javascript Distribution Builder: https://quentinandre.github.io/DistributionBuilder
Don Moore and Uriel Haran’s SPIES elicitation tool: http://fbm.bgu.ac.il/lab/spies/spies.html
Charlie Strout’s Javascript Distribution Builder: https://github.com/sevenshadow/DistributionBuilder
####################
GALLONS PER MILE TOOL
Rick Larrick and Jack Soll created an online GPM (gallons per mile) calculator to help people compare cars/trade ins. http://gpmcalculator.com/
Cite:
Larrick, R. P., & Soll, J. B. (2008). The MPG illusion. Science, 320(5883), 1593.
####################
DECISION TIME LIMITS
Ian Krajbich writes “By imposing per-decision time limits, we help people divert time from difficult unimportant decisions to easier important ones.”
Effectiveness test result: Time-constrained subjects achieve better objective outcomes (higher earnings) when they have per-decision time limits, compared to when they are left to allocate time to decisions on their own.
Cite:
Oud B, Krajbich I, Miller K, Cheong JH, Botvinick M, Fehr E. 2016 Irrational time allocation in decision-making. Proc. R. Soc. B 283: 20151439. http://dx.doi.org/10.1098/rspb.2015.1439
####################
BALANCE BEAM AID FOR INSTRUCTION IN DIAGNOSIS
Rob Hamm writes “The log odds formula for combining multiple independent diagnostic cues corresponds to the formula for combining the impact of equal weights (and helium balloons) placed at different positions on a balance beam. We constructed a demonstration for one medical diagnosis domain (acute chest pain).”
Effectiveness test result: The math works if we make the naïve Bayesian assumption of independent impacts of different pieces of evidence. A small sample of medical students and faculty played with the program and found it reasonable.
Cites:
Hamm RM, Beasley WH, Johnson WJ. A balance beam aid for instruction in clinical diagnostic reasoning. Medical Decision Making 2014; 34(7):854-862 (doi: 10.1177/ 0272989X14529623).
Hamm RM, Beasley WH. The balance beam metaphor: A perspective on clinical diagnosis. Medical Decision Making 2014; 34(7):841-853 (doi: 10.1177/0272989X14528755).
####################
PACE-O-METER TO IMPROVE PEOPLE’S ESTIMATIONS OF TIME-SAVINGS WHEN INCREASING SPEED
Eyal Pe’er writes: “An enhanced speedometer that presents, alongside regular speed information, the pace of minutes required to complete 10 miles/km at given levels of speed (http://journal.sjdm.org/12/121007/fig2.png)
Effectiveness test result: When asked to estimate time saved when increasing speed (at various levels) participants who received the “paceometer” were correct at an overall average rate of about 58% compared to less than 20% in the control conditions. In another study, similar results were found on driving behavior using a driving simulator.
Cites:
Peer, E., & Gamliel, E. (2013). Pace yourself: Improving time-saving judgments when increasing activity speed. Judgment and Decision Making, 8(2), 106.
Eriksson, G., Patten, C. J., Svenson, O., & Eriksson, L. (2015). Estimated time of arrival and debiasing the time saving bias. Ergonomics, 58(12), 1939-1946.
####################
PROSTATE CANCER TREATMENT DECISION AID
Maarten Cuypers writes: “Online tool with risk communication and values clarification exercise to support treatment selection in (early) prostate cancer patients”
Effectiveness test result: More knowledge, more value congruent treatment choices, though lower information satisfaction.
Cites:
Cuypers, Maarten, Lamers, Romy, Kil, Paul, Poll-Franse, L. van de, & Vries, Marieke de (2015). Impact of a web-based treatment decision aid for early-stage prostate cancer on shared decision-making and health outcomes: Study protocol for a randomized controlled trial. Trials, 16(231)
Lamers, R.E.D., Cuypers, M., Vries, M. de, Poll-Franse, L. van de, Bosch, J.L.H.R., & Kil, P.J.M. (2016). How do patients choose between active surveillance, radical prostatectomy and radiotherapy?: The effect of a preference sensitive decision aid on treatment decision making for localized prostate cancer. Urologic Oncology: Seminars and Original Investigations
####################
SIMULATED EXPERIENCE
Emre Soyer writes “A simulation based on a model (e.g., regression), which allows decision makers to enter their inputs and sequentially observe (also graph and/or store) the estimated outcomes.”
Effectiveness test result: In different contexts, participants related easily with the tool, trusted their simulated experience more than their own analyses based on descriptions, and made more accurate judgments about uncertainties.
Cites:
Hogarth, R. M., & Soyer, E. (Winter 2015). Simulated experience: Making intuitive sense of big data. MIT Sloan Management Review, p. 49-54. (sloanreview.mit.edu/x/56215)
Hogarth R. M., & Soyer E. (2015). Communicating forecasts: The simplicity of simulated experience. Journal of Business Research, 68, 1800-1809
Hogarth R. M., & Soyer E. (2015). Providing information for decision making: Contrasting description and simulation. Journal of Applied Research in Memory and Cognition, 4, 221-228.
Hogarth R. M., Mukherjee, K., & Soyer, E. (2013). Assessing the chances of success: Naïve statistics vs. kind experience. Journal of Experimental Psychology: Learning, Memory and Cognition, 39, 14-32.
Hogarth, R. M., & Soyer, E. (2011). Sequentially simulated outcomes: Kind experience vs. non-transparent description. Journal of Experimental Psychology: General, 140, 3, 434-463.
M.A. Bradbury, T. Hens and S. Zeisberger, “Improving Investment Decisions With Simulated Experience,” Review of Finance, published online June 6, 2014.
C. Kaufmann, M. Weber and E. Haisley, “The Role of Experience Sampling and Graphical Displays on One’s Investment Risk Appetite,” Management Science 59, no.2 (February 2013): 323-340.
B.K. Hayes, B.R. Newell and G.E. Hawkins. “Causal Model and Sampling Approaches to Reducing Base Rate Neglect,” in “Proceedings of the 35th Annual Conference of the Cognitive Science Society,” eds. M. Knauff, M. Pauen, N. Sebanz and I. Wachsmuth (Austin, Texas: Cognitive Science Society, 2013.)
####################
A DIAGNOSTIC SUPPORT SYSTEM (PROTOTYPE) FOR FAMILY PHYSICIANS
Olga Kostopoulou writes “A diagnostic support tool that integrates with the patient’s electronic health record, and presents physicians with diagnostic alternatives (according to patient age, sex, risk factors and current complaint) at the start of the consultation, BEFORE physicians elicit any further information from the patient.”
Effectiveness test result: Presenting family physicians with diagnostic alternatives early on, before eliciting any information themselves, increased diagnostic accuracy both in a study with computer-simulated patients, and in a study with standardised patients (actors).
Cites:
Kostopoulou O, Rosen A, Round T, Wright E, Douiri A, Delaney BC. Early diagnostic suggestions improve accuracy of GPs: a randomised controlled trial using computer-simulated patients. British Journal of General Practice 2015 Jan; 65(630): e49-e54. http://dx.doi.org/10.3399/bjgp15X683161
Kostopoulou O, Porat T, Corrigan D, Mahmoud S, Delaney BC. Supporting first impressions reduces diagnostic error: evidence from a high-fidelity simulation. British Journal of General Practice. In Press.
Note: The tool is still at the prototype stage and has not been field-tested yet. It is based on an ontology of medical diagnostic concepts, and will be open source eventually.
####################
ANALOGICAL ENCODING
Aba Szollosi writes “We tested whether analogical encoding can foster the transfer from learning abstract principles to improving behavioral performance on a range of decision biases.”
Effectiveness test result: The method might be effective in eliminating biases on tasks where the violations of statistical principles are measured.
Relevant cite(s): Aczel, B., Bago, B., Szollosi, A., Foldes, A., & Lukacs, B. (2015). Is it time for studying real-life debiasing? Evaluation of the effectiveness of an analogical intervention technique. Frontiers in psychology, 6:1120. doi: 10.3389/fpsyg.2015.01120
####################
CHEMDECIDE
Richard Hodgett writes about a tool he created to structure complex decision problems. ChemDecide is a suite of software tools which incorporates three Multi-Criteria Decision Analysis (MCDA) techniques: Analytical Hierarchy Process (AHP), Multi-Attribute Range Evaluations (MARE) and ELimination Et Choix Traduisant la REalité trois (ELECTRE III). The software has been used for addressing decisions such as route selection, equipment selection, resource allocation, financial budgeting and project prioritization.
Cite: Hodgett, R. E., Martin, E. B., Montague, G., & Talford, M. (2014). Handling uncertain decisions in whole process design. Production Planning & Control, 25(12), 1028-1038.
MICROSOFT RESEARCH NEW YORK CITY
Microsoft Research NYC seeks outstanding applicants for researcher and postdoctoral positions in computational social science. Successful applicants will have strong quantitative and programming skills. For more information, see the call at the MSR NYC Computational Social Science website.
SPECIAL NOTE TO DECISION SCIENCE NEWS READERS
DEADLINE THIS FRIDAY NOVEMBER 18, 2016
FABBS (Federation of Associations in Brain and Behavioral Sciences) is a coalition of scientific societies that share an interest in advancing the sciences of mind, brain, and behavior.
To recognize scientists who have made outstanding research contributions, FABBS grants early career impact awards. (Here early means within 10 years of receiving a PhD.)
Awards are rotated tri-annually among various subsets of societies that are members of this larger federation.
In 2017, the subset includes the Society for Judgment and Decision Making (SJDM).
Accordingly, we are seeking nominations for the FABBS early career impact award.
If you wish to recognize the contributions of a judgment and decision making (JDM) scholar who obtained their PhD in the last 10 years, please email the name of your nominee to Shane Frederick (shane.frederick at yale.edu) by this Friday, November 18th, 2016.
The SJDM executive board will review the set of nominees and make our recommendation to FABBS by November 30, 2016.
Those seeking more information about this award can obtain it here:
http://www.fabbs.org/fabbs-foundation/early-career-investigator-award/
JUST ABOUT EVERYONE GOT IT WRONG, SOME CLASSES OF PREDICTIONS WERE LESS WRONG
We know Decision Science News isn’t your main news source and assume you know that Donald Trump surprised many and won the election last night.
Models like the Princeton Election Consortium, which put Clinton’s probability of winning at 99%, probably need re-examining. Even PollyVote which averages polls, models, expert judgment, prediction markets, and citizen forecasts, forecast Clinton would win with 99% probability. It’s an average of 20 sources: none of which predicted Trump would win the most electoral votes. Historically, the average of many predictions is hard to beat.
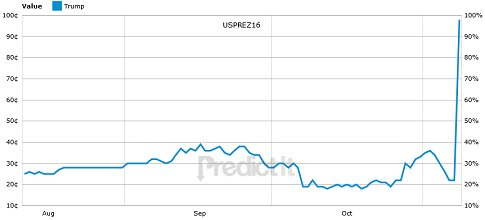
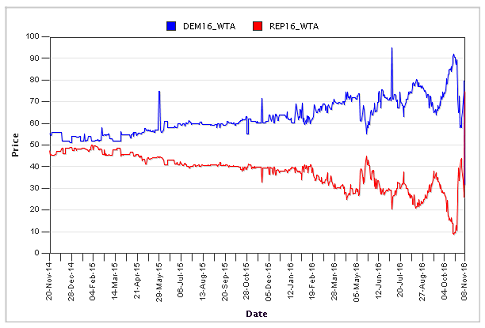
The PredictIt prediction market (pictured above), mispredicted it though prediction markets weren’t that bad compared to other classes of forecast. In November, PredictIt was assigning Trump a 25-30% probability of winning. We bet against Trump on PredictIt when he was at 36% (2 or 3:1) and lost. This is sad for more than one reason.
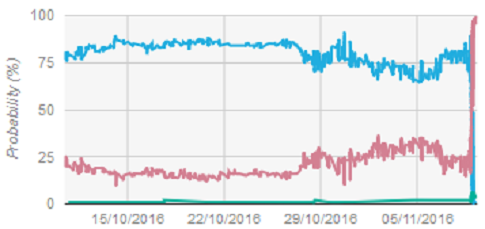
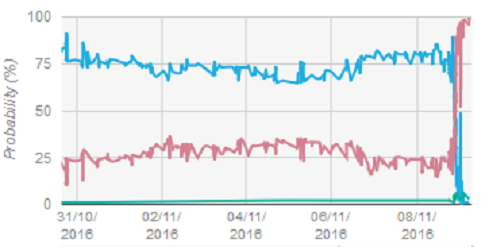
Prediction market Hypermind (pictured below, lower graph is zoomed to November), fared similarly, giving Trump over a 25% chance in much of November (dates are written DD-MM-YY because Europe).
The Iowa Electronic Markets prediction market results are below. This is actually a winner take all market based on the popular vote plurality winner, but it’s close enough for jazz, meaning that people probably treat it the same as if it predicted the electoral vote winner(*). Note that this chart is on a different time scale (and we don’t have time to do anything about that), but focus on the period since August to compare to PredictIt and the period since October to compare to Hypermind. They had some volatility in predictions, going from 40% Trump down to 10% and back up to 40% a week before the election, though the average November prediction is comparable to PredictIt and Hypermind.
The summary is that all the prediction markets were wrong, but they weren’t steadily predicting 10:1 against Trump either.
Prediction market predictions were less wrong, going by something like Brier Score. Prediction markets predicted something near 20% to 25% Trump and a 4:1 or 3:1 horse won the race. As the French say ça arrive.
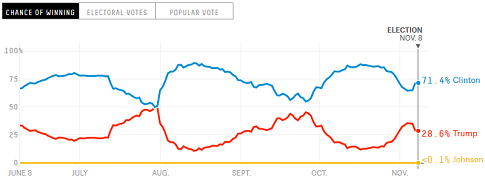
We could talk about more unique predictors like fivethirtyeight.com (below) which were volatile but still over 25% in November, and Keys to the White House, which is a simple tallying model that actually and barely predicted that Trump would win. However, we feel it’s better to talk about classes of predictions (like expert judgments or prediction markets or models) than unique cases. Also fivethirtyeight.com made three different forecasts, so, how fair is that?
(*) One interesting thing is that the IEM market was correctly predicting that Hillary would capture the majority of the popular (as opposed to electoral) vote going into the election. On election day, it moved the wrong way (predicting Trump would win the popular vote). The day after the election it predicted a 95% chance that Hillary would win the popular vote.
SOCIETY FOR JUDGMENT AND DECISION MAKING CONFERENCE STARTS FRI NOV 18, 2016
What: SJDM 2016 Conference
When: November 18 to 21, 2016
Where: Sheraton Boston Hotel, 39 Dalton St, Boston, MA 02199
Special Features
* Plenary address by Linda Babcock
* Tribute to Baruch Fischhoff
* Presidential address by Dan Goldstein
* Women in JDM networking event
* Einhorn Award revelation
* Social event at a swank speakeasy
As the Society for Judgment and Decision Making conference is right around the corner, it’s time to make your last minute travel and hotel arrangements if you haven’t already. There have been quite a few early online registrations, and total registrations are expected to number around 675. It’s too late to register online, but you can do so in person at the conference (which 15% to 20% of people do). At $400 onsite for members ($200 for student members), it’s one of the least expensive conferences around. It would be cheaper than that but, you know, Boston. If you aren’t a member, you can join here for $50.
You can download the current copy of the program here. As you know, the talks were selected by a representative panel of reviewers this year and we see many amazing talks and posters on the program.
See you soon in Boston!
THINK ONE AND A ZERO
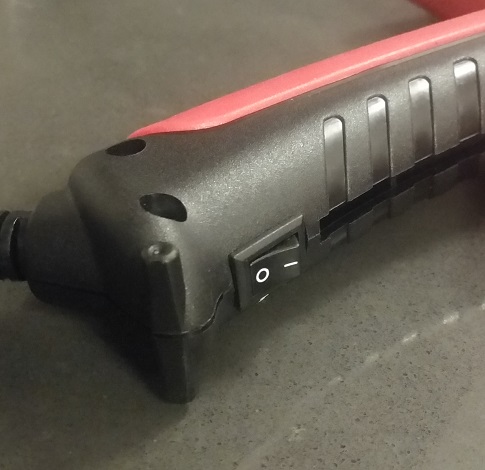
Is our new glue gun powered on or off?
We were recently in a hotel in Berlin Germany and the room heater had the line-circle (| O) symbol on it and we couldn’t remember whether line means on and circle means off, or the line means off and circle means on.
Quality German engineering made the heater silent so there was no way to tell by listening.
The next day we got home to find our new glue gun had arrived. Same problem. And glue guns take a few minutes to heat up so that’s annoying (and possibly dangerous)
Turns out it’s best not to think of it as a line and circle.
Think of it as a 1 and 0.
Recall your computer science, logic, electrical engineering, whatever classes:
0 is FALSE, low voltage, or off
1 is TRUE, high voltage, or on
Boom. Retained for life.
Want to remember which side of your rental car the gas cap is on?
A JAVASCRIPT LIBRARY FOR ADDING DISTRIBUTION BUILDERS TO YOUR EXPERIMENTS
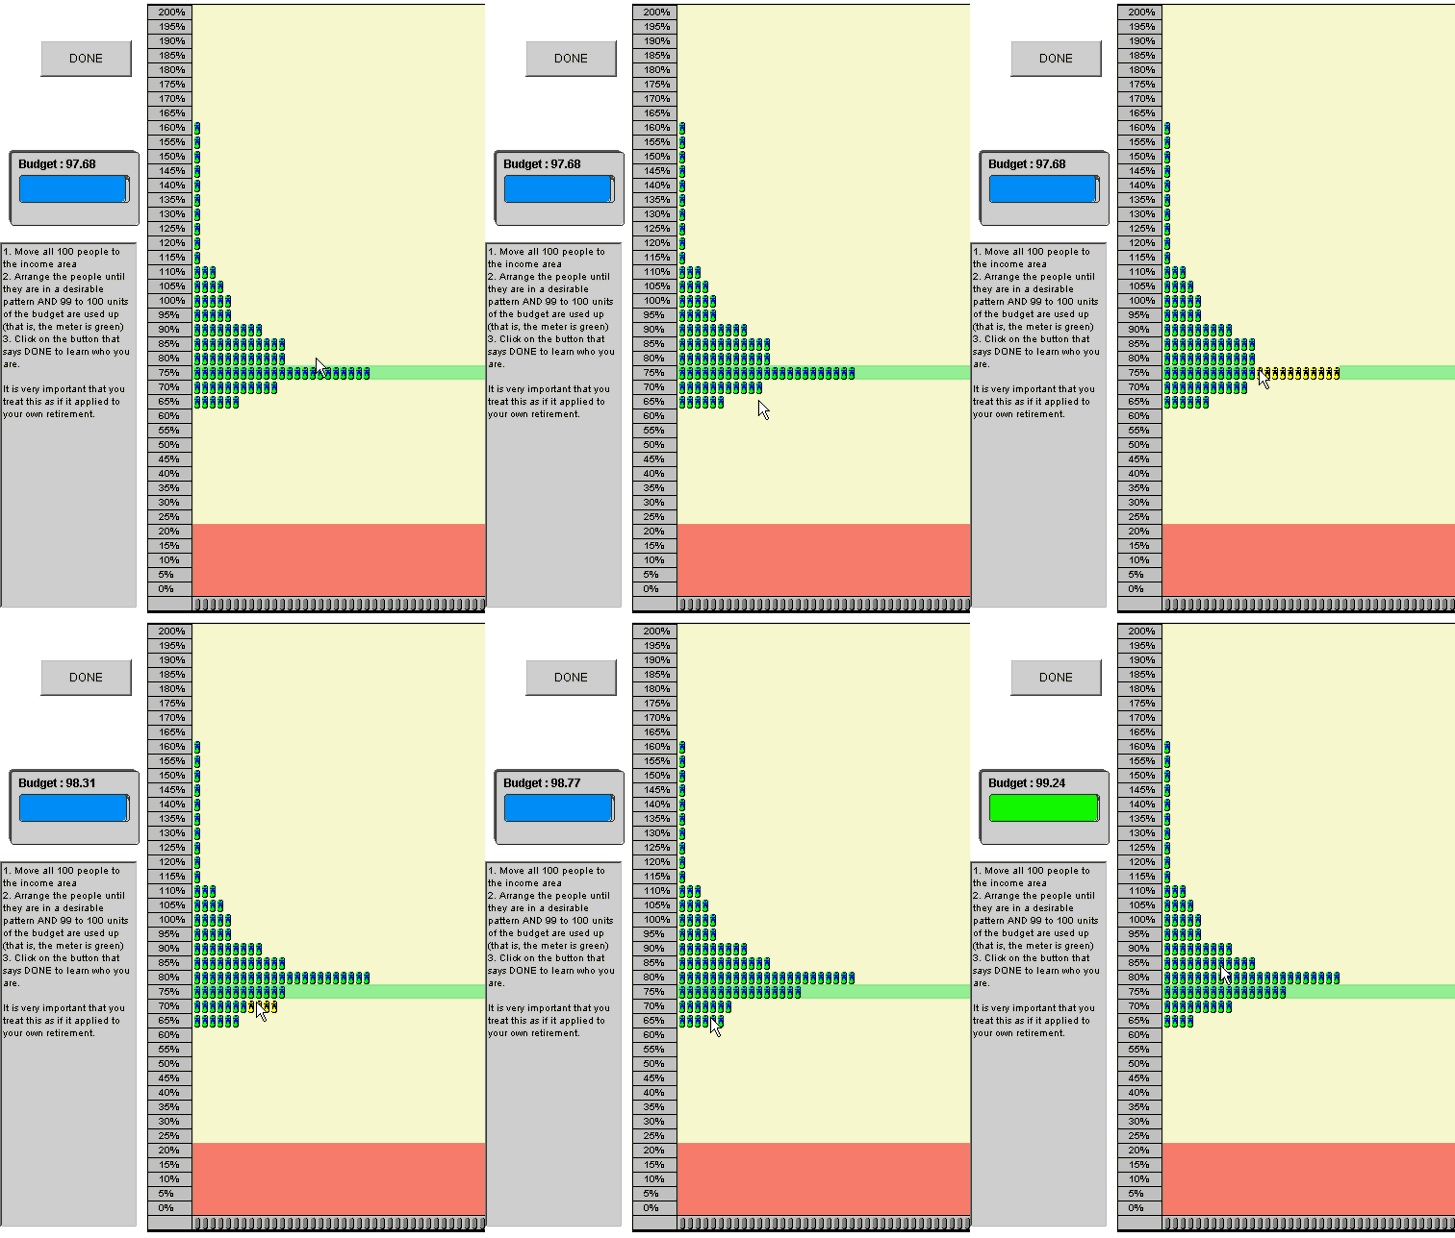
The drag-and-drop style Distribution Builder of Goldstein Johnson and Sharpe (2008).
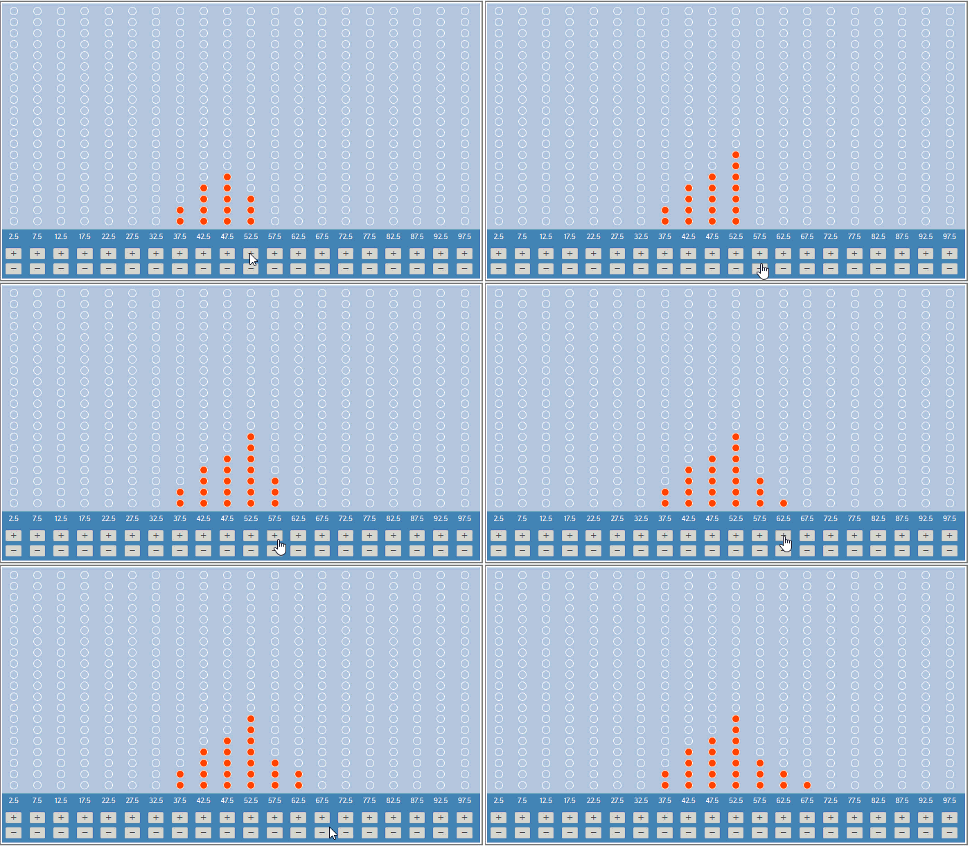
A balls-and-buckets style Distribution Builder using Quentin André’s Javascript tool.
If you read this website, you probably want to elicit probability distributions from people. A Distribution Builder (DB for short) does just that, and elicits them as cognitively-friendly frequency histograms.
The Distribution Builder was created by Dan Goldstein, Bill Sharpe and Phil Blythe in the year 2000 and its first major publication was in 2008. The DB is a digital implementation of a method that was first used, as far as we can tell, by Kabus using poker chips in 1976, as cited in this paper by Goldstein and Rothschild (2014), which found that elicitation using a distribution builder beat conventional methods.
Now for the news. Quentin André has built a JavaScript distribution builder that anyone can use and adapt. It creates ball-and-bucket style distribution builders, and has a nice Web site full of documentation.