MPI SUMMER SCHOOL 2013: DECISION MAKING IN A SOCIAL WORLD. DUNCAN WATTS KEYNOTE

Summer Institute on Bounded Rationality
Decision Making in a Social World
This summer Gerd Gigerenzer and Ralph Hertwig will host the annual Summer Institute on Bounded Rationality, with a focus on “Decision Making in a Social World”.
Dr. Duncan Watts of Microsoft Research, author of “Six Degrees: The Science of a Connected Age”, will give the keynote address. This year marks the first time the event is jointly presented by the Center for Adaptive Behavior and Cognition as well as the Center for Adaptive Rationality at the Max Planck Institute for Human Development in Berlin.
Join renowned faculty and international participants across various disciplines for talks and workshops during the one-week Summer Institute. 35 young scholars will have the opportunity to explore how bounded rationality helps the navigation of the complex social world, as well as present their research and receive feedback from and network with distinguished researchers and fellow young scholars.
We invite talented graduate students and post-doctoral fellows to apply before April 10, 2013. Details on the Summer Institute and the application process are available at http://www.mpib-berlin.mpg.de/de/forschung/adaptives-verhalten-und-kognition/summer-institute-on-bounded-rationality.
Questions are welcomed to summerinstitute2013@mpib-berlin.mpg.de.
Feel free to pass the information on to interested (and interesting) researchers.
Filed in
Ideas
 Subscribe
 to Decision Science News by Email (one email per week, easy unsubscribe)
HERE ARE YOUR ANSWERS

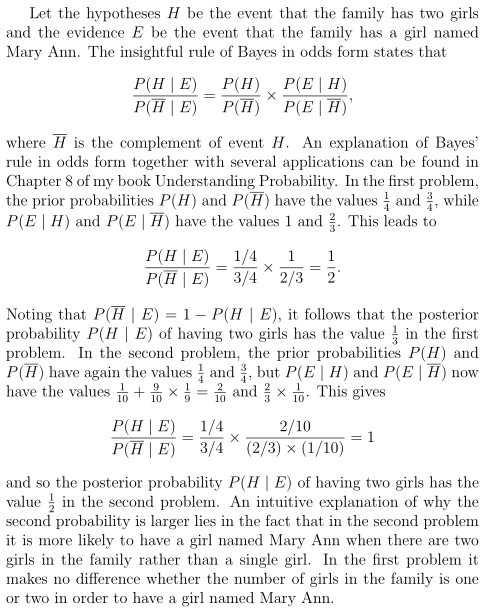
Last week we posted two fun probability problems. If you haven’t given them the old college try do so now, because this week we present you with the answer, provided by the man who supplied the problems, author and Professor of Operations Research and Probability Henk Tijms. Voila.
Enjoy this kind of thing? Try the Tuesday’s child is full of probability problems problem.
Filed in
Ideas
Subscribe to Decision Science News by Email (one email per week, easy unsubscribe)
COUNTERINTUITIVE PROBABILITIES REDUX

Drawn in by our post Tuesday’s child is full of probability problems, author and Professor of Operations Research and Probability Henk Tijms writes in with two new puzzles:
Problem 1:
An isolated island is ruled by a dictator. Every family on the island has two children. Each child is equally likely a boy or a girl. The dictator has decreed that each first-born girl (if any) in the family should bear the name Mary Ann (the name of the beloved mother-in-law of the dictator). Two siblings never have the same name. You are told that a randomly chosen family that is unknown to you has a girl named Mary Ann. What is the probability that this family has two girls?
Problem 2:
The dictator has passed away. His son, a womanizer, has changed the rules. For each first-born girl in the family a name must be chosen at random from 10 specific names including the name Mary Ann, while for each second-born girl in the family a name must be randomly chosen from the remaining 9 names. What is now the probability that a randomly chosen family has two girls when you are told that this family has a girl named Mary Ann? Can you intuitively explain why this probability is not the same as the previous probability?
If you need a hint, he adds this postscript:
P.S. As you know, the wording in this kind of problems is crucial. I found that the best approach to attack this kind of problems is to use Bayes’ rule in odds form. This specific form of Bayes forces you to make transparent the assumption you are (implicitly) making in solving the problem. I take the liberty to mention that in the recent third edition of my book Understanding Probability (Cambridge University Press, 2012), I advocate the use of Bayes’ rule in odds form (and Bayesian thinking in general).
Who can solve it first?
Filed in
Ideas ,
R
Subscribe to Decision Science News by Email (one email per week, easy unsubscribe)
EVERYDAY RISKY CHOICE
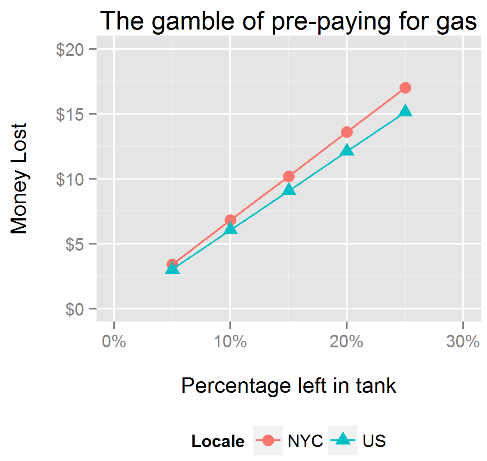
One question we get asked a lot is whether it’s worth it to pre-pay for the tank of gas when renting a car.
At first, blush it seems like something you should never do. In the best case, you pay market rate for gas, and in the worst case, you pay for a tank of gas you never consume (what if your trip gets cancelled)?
At second blush, it can be worth the risk to avoid the hassle of fueling up just before returning the car. If your time and peace of mind are worth something, then maybe you should pre-pay when you are reasonably sure you’ll return it below a certain percentage full. But what percentage?
To help with this decision, we’ve calculated the amount of money you waste when returning the car at various percentages full (above). We plugged in the New York City price of gas we face ($4) and the current national average ($3.56). For us, the hassle of refueling in the South Bronx after a weekend in the country is about $5, so we should probably pre-pay when we’re pretty sure we’ll return the car about 5-10% full.
We discussed this topic with Sid Suri and concluded that many factors go into this decision:
- Freedom from stress of having to fill up
- Stress of trying to run the tank down as low as possible without running out of gas (sure, it’s a commission of the sunk cost fallacy, but we’re humans)
- The thrill of returning the car right before it runs out of gas
- Time of day of return
- Cognitive costs of deciding how much gas to purchase during a trip so it’s nearly empty upon return
- Safety of gas station near return location
- Gas lines (we once pre-paid after Hurricane Sandy and avoided a several-hour long gas line)
- The “fee” for returning the car less than 100% full (something like $8 / gallon) vs. the expected loss by pre-paying
We think that:
- It would be much better if you could just pre-pay for a quarter tank instead of a tank. We’d even accept a small fee to do this.
- Most people who pre-pay are sticking it to their employers.
Graphs were made in R using Hadley Wickham’s ggplot2 package.
Code is here:
library(ggplot2)
library(scales)
NYC=4
NAT=3.56
pl=seq(.05,.25,.05)
gal=pl*17
nycost=gal*NYC
natcost=gal*NAT
mdf=data.frame(
Percentage_full=c(pl,pl),
Cost=c(nycost,natcost),
Locale=c(rep("NYC",length(pl)),rep("US",length(pl))))
p=ggplot(mdf,aes(Percentage_full,Cost,group=Locale,
        color=Locale,shape=Locale))
p=p+geom_point(size=3)+geom_line()
p=p+scale_x_continuous("\nPercentage left in tank",limits=c(0,.3),
	labels=percent_format())
p=p+scale_y_continuous("Money Lost\n",limits=c(0,20),
        labels=dollar_format())
p=p+theme(legend.position="bottom")
p=p+ggtitle("The gamble of pre-paying for gas")
p
DOES IT MATTER WHERE IT IS KICKED? ANALYSIS OF OVER 10,000 ATTEMPTS
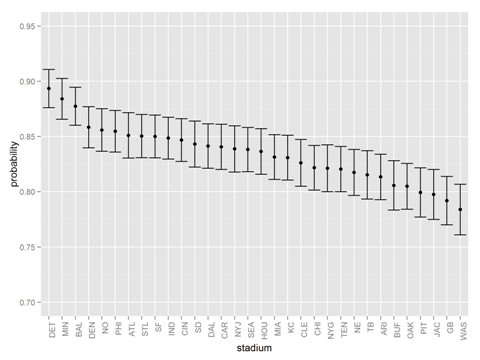
Click to enlarge
In our third of not one, not two, but three posts on kicking a football in the NFL, we take on a reader question of whether the stadium / home team matters for making a field goal. We pulled up the data on every field goal since 2002 (over 10,000) of them and plotted the probability of scoring as a function of the stadium in which the field goal was kicked. The results are above. Bars are +/- 1 standard error.
Is it a statistically significant effect? Apparently so:
Pearson's Chi-squared test
X-squared = 49.9556, df = 31, p-value = 0.01693
ADDENDUM 1
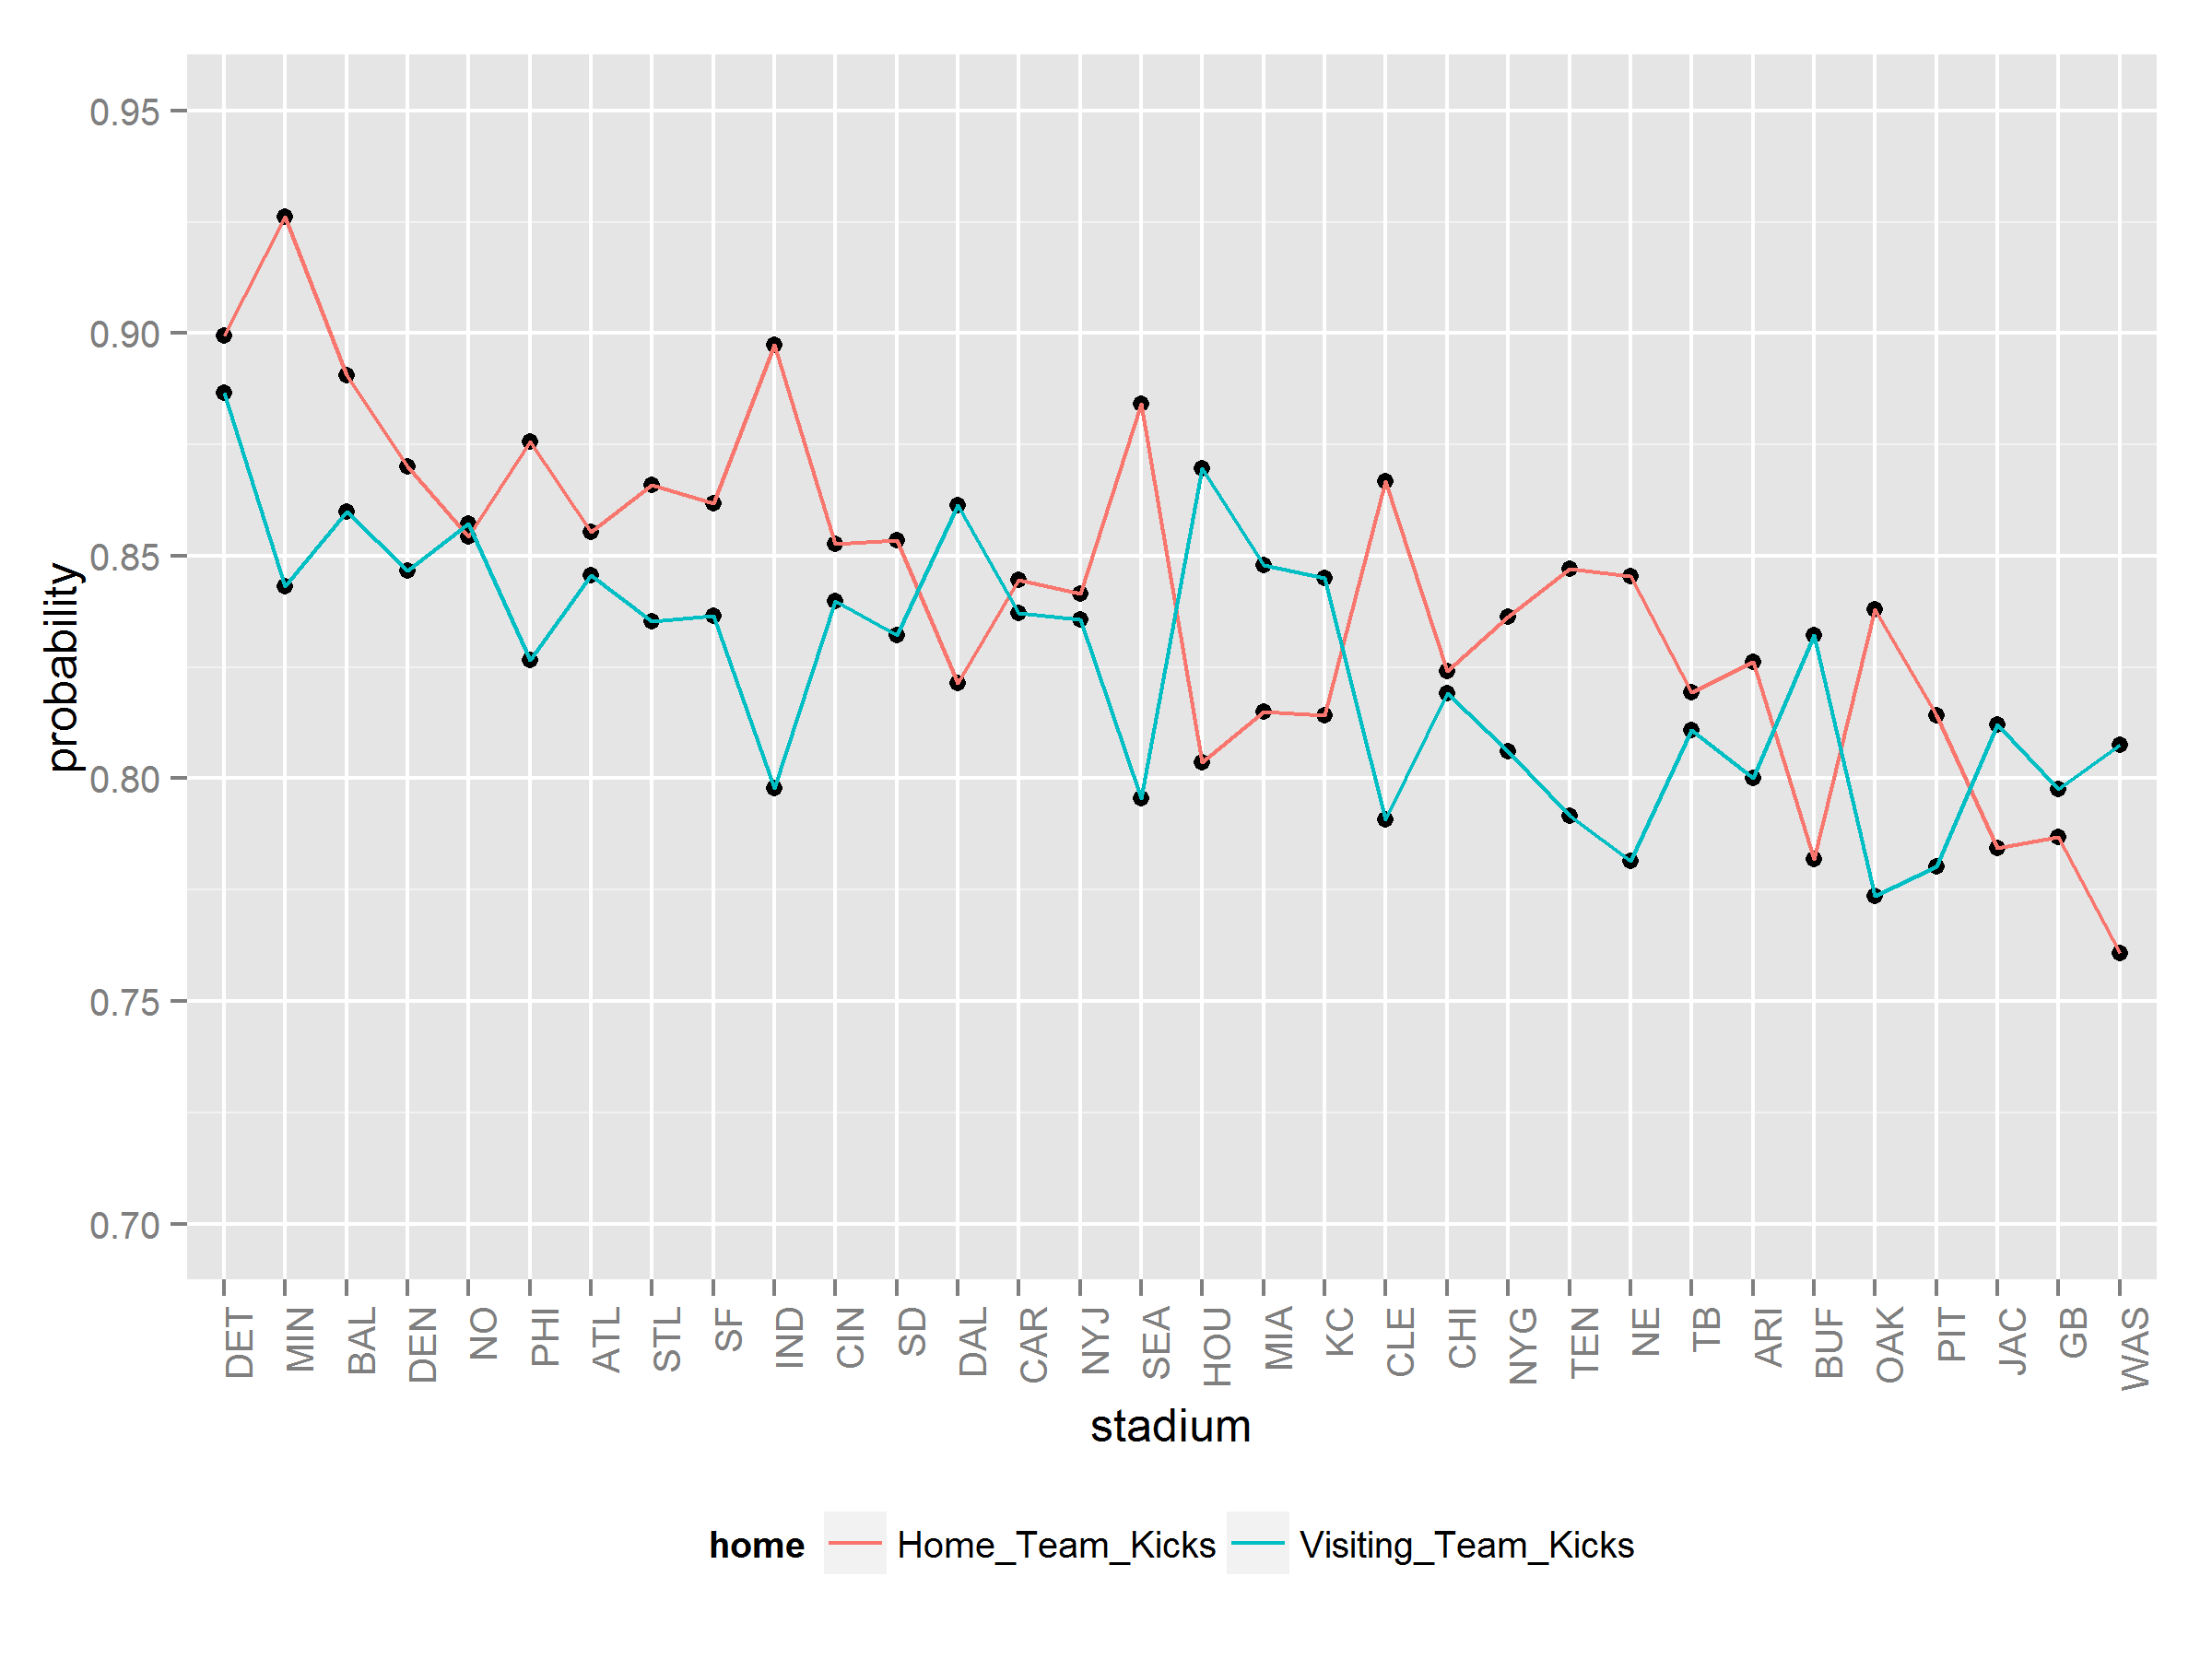
We had a request to see the broken down by home team or visiting team kicking. Here you go:
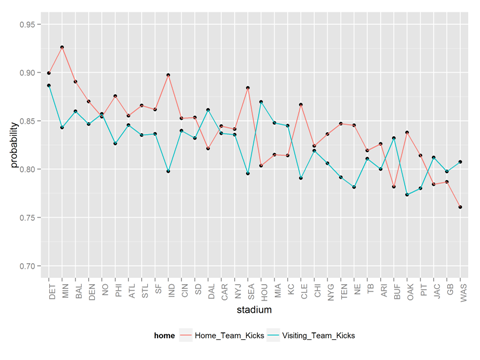
Click to enlarge
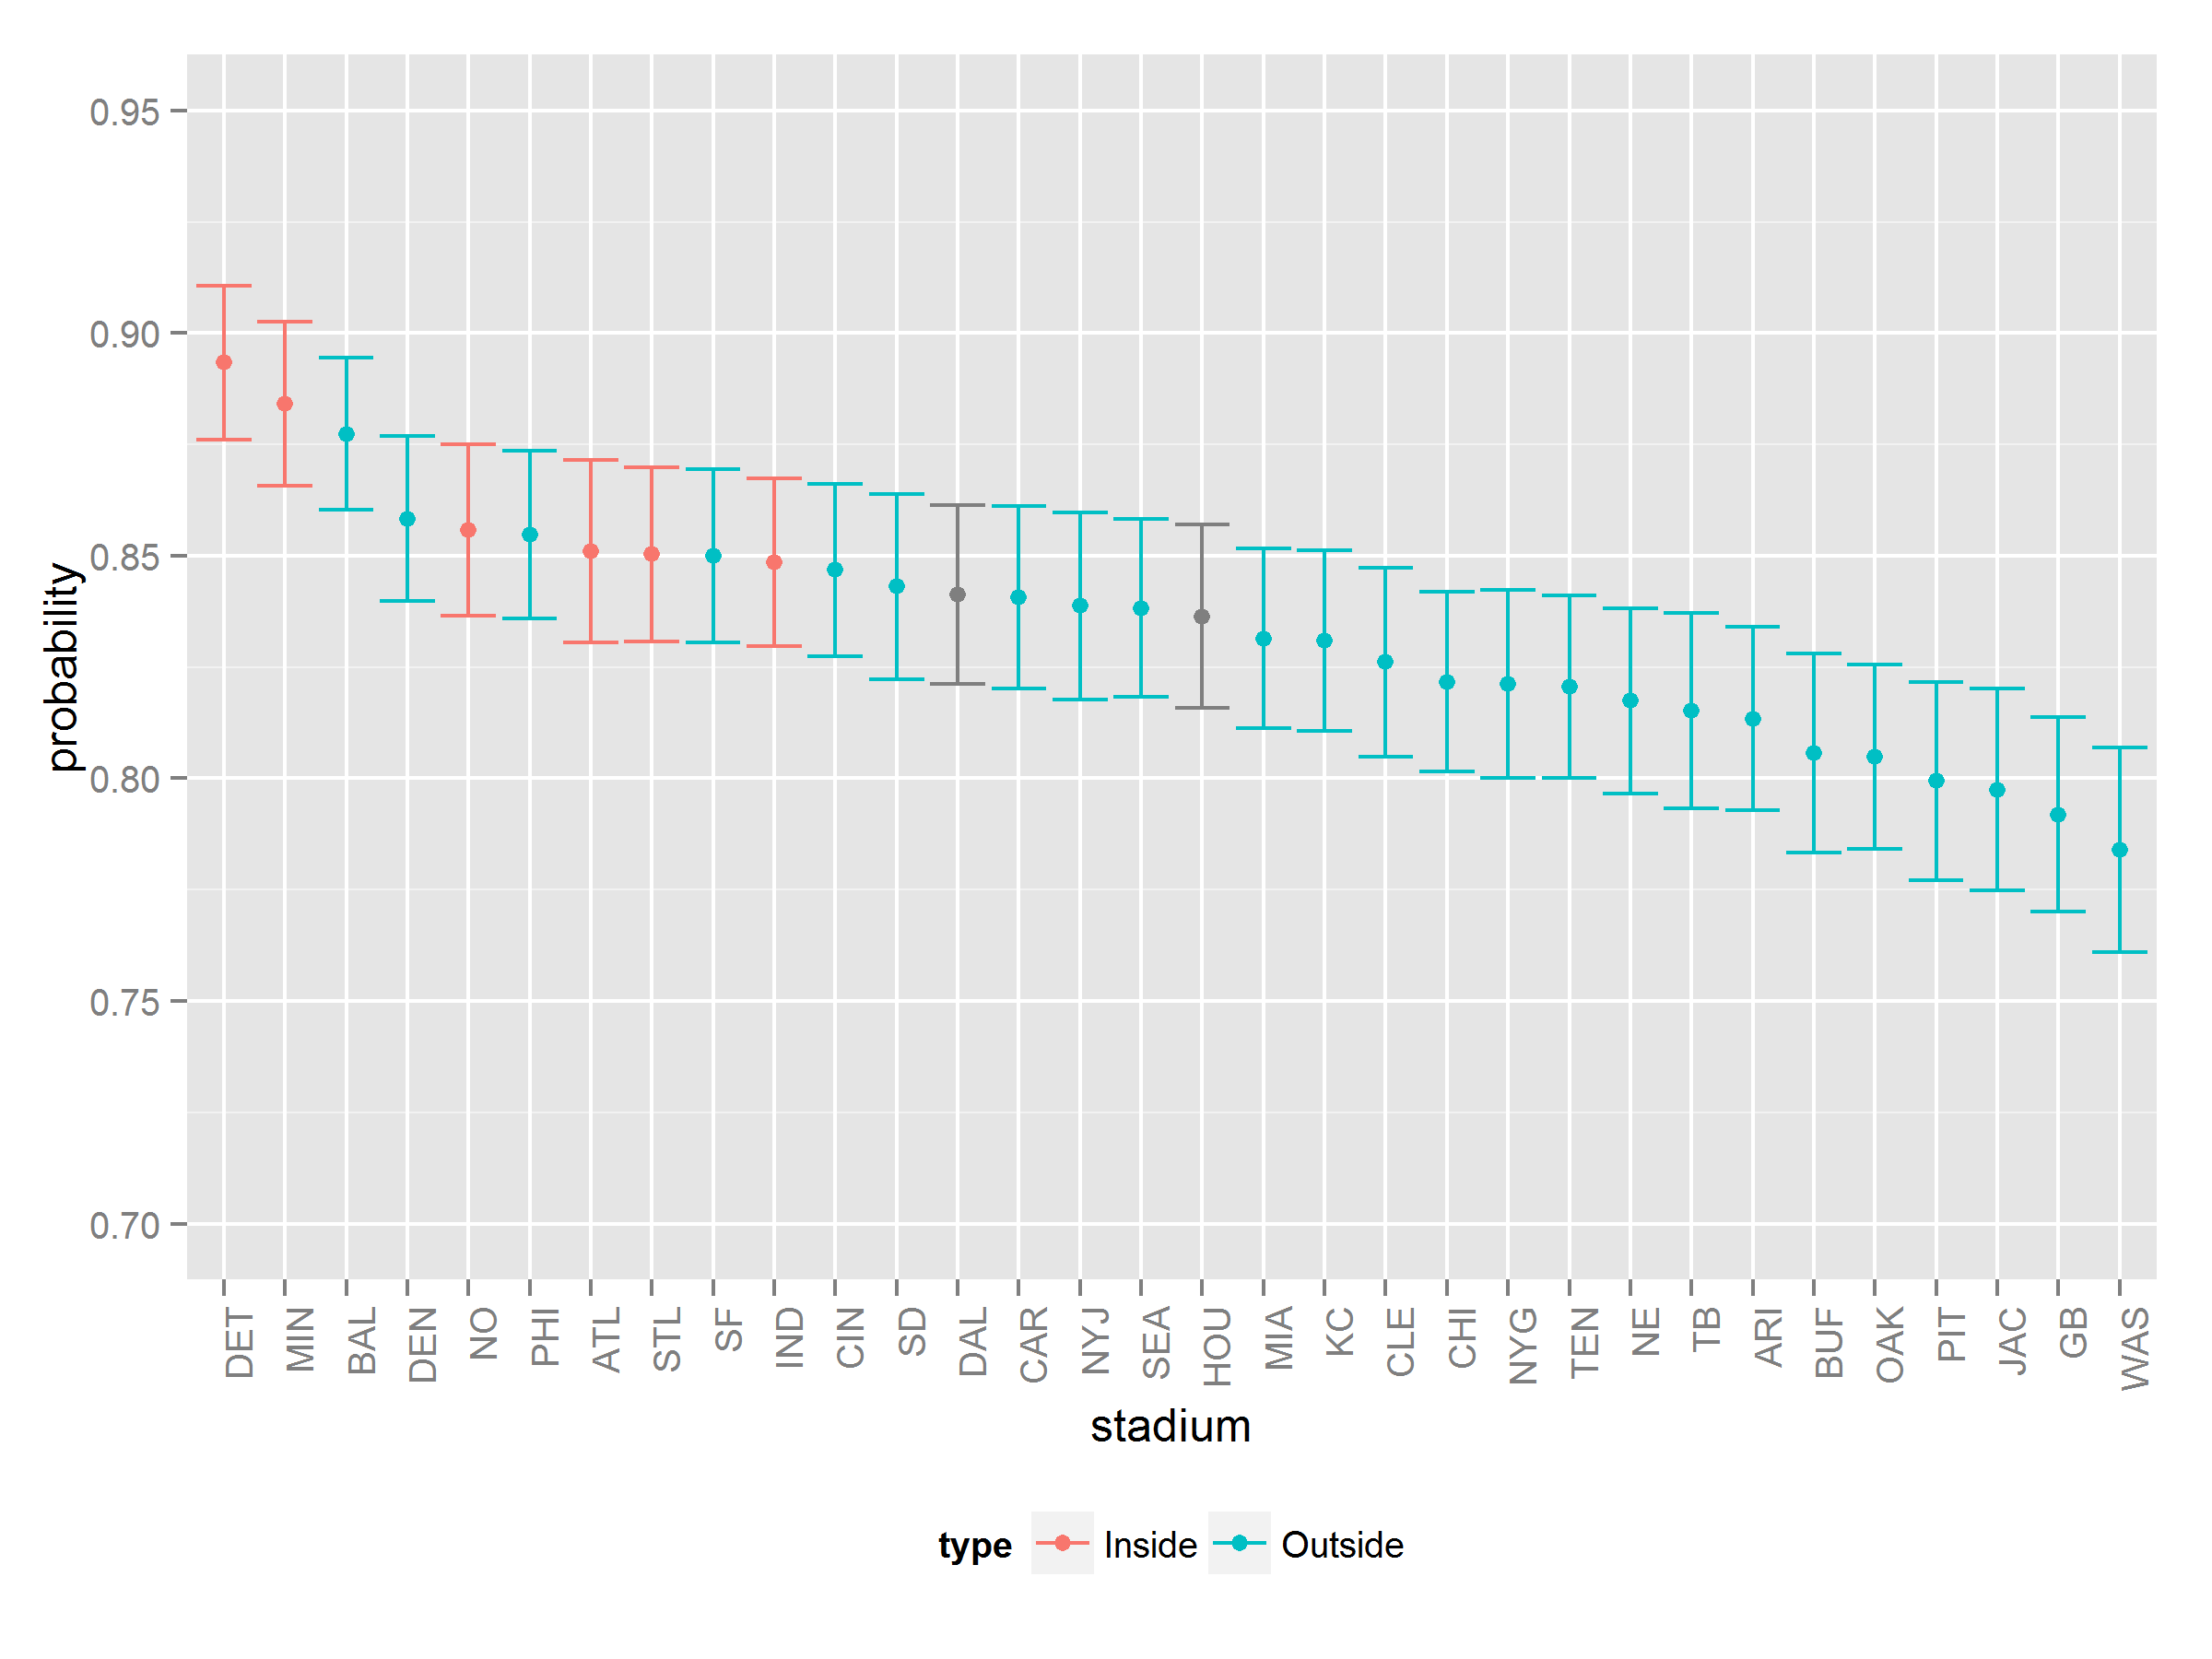
ADDENDUM 2:
Owing to the generosity of the great reader / Scottish economist Adam Smith (see comments), we now have the stadiums broken down by door (indoor or outdoor). The gray stadiums are either convertible (Houston) or have a small hole in the roof (Dallas).
Correlation is not causation, but it sure does seem plausible that having an indoor stadium helps the kicker.
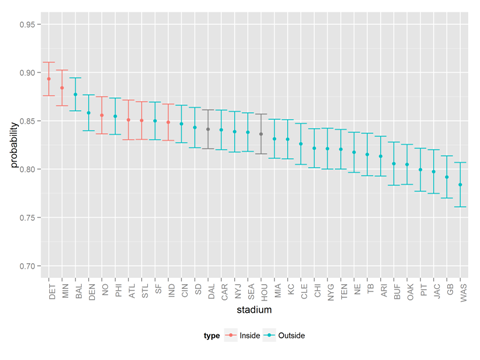
Click to enlarge
APPENDIX
To decode the team names, use this list:
ARI: Arizona Cardinals
ATL: Atlanta Falcons
BAL: Baltimore Ravens
BUF: Buffalo Bills
CAR: Carolina Panthers
CHI: Chicago Bears
CIN: Cincinnati Bengals
CLE: Cleveland Browns
DAL: Dallas Cowboys
DEN: Denver Broncos
DET: Detroit Lions
GB: Green Bay Packers
HOU: Houston Texans
IND: Indianapolis Colts
JAX: Jacksonville Jaguars
KC: Kansas City Chiefs
MIA: Miami Dolphins
MIN: Minnesota Vikings
NE: New England Patriots
NO: New Orleans Saints
NYG: New York Giants
NYJ: New York Jets
OAK: Oakland Raiders
PHI: Philadelphia Eagles
PIT: Pittsburgh Steelers
SD: San Diego Chargers
SEA: Seattle Seahawks
SF: San Francisco 49ers
STL: Saint Louis Rams
TB: Tampa Bay Buccaneers
TEN Tennessee Titans
WAS: Washington Redskins
Figure 1 Data:
Stadium   Miss Hit
ARI         67 292
ATL         45 257
BAL         45 322
BUF         61 253
CAR         51 269
CHI         64 295
CIN         53 293
CLE         56 266
DAL         53 281
DEN         50 303
DET         34 285
GB          72 274
HOU         53 271
IND         55 308
JAC         64 252
KC          58 285
MIA         58 286
MIN         35 267
NE          63 282
NO          48 285
NYG         59 271
NYJ         50 260
OAK         72 297
PHI         51 300
PIT         65 259
SD          48 258
SEA         55 285
SF          51 289
STL         50 284
TB          58 256
TEN         63 288
WAS         70 254
Figure 2 Data:
ARI     Home_Team_Kicks         32 152
        Visiting_Team_Kicks     35 140
ATL     Home_Team_Kicks         24 142
        Visiting_Team_Kicks     21 115
BAL     Home_Team_Kicks         23 187
        Visiting_Team_Kicks     22 135
BUF     Home_Team_Kicks         36 129
        Visiting_Team_Kicks     25 124
CAR     Home_Team_Kicks         23 125
        Visiting_Team_Kicks     28 144
CHI     Home_Team_Kicks         32 150
        Visiting_Team_Kicks     32 145
CIN     Home_Team_Kicks         28 162
        Visiting_Team_Kicks     25 131
CLE     Home_Team_Kicks         20 130
        Visiting_Team_Kicks     36 136
DAL     Home_Team_Kicks         30 138
        Visiting_Team_Kicks     23 143
DEN     Home_Team_Kicks         23 154
        Visiting_Team_Kicks     27 149
DET     Home_Team_Kicks         17 152
        Visiting_Team_Kicks     17 133
GB      Home_Team_Kicks         39 144
        Visiting_Team_Kicks     33 130
HOU     Home_Team_Kicks         32 131
        Visiting_Team_Kicks     21 140
IND     Home_Team_Kicks         19 166
        Visiting_Team_Kicks     36 142
JAC     Home_Team_Kicks         36 131
        Visiting_Team_Kicks     28 121
KC      Home_Team_Kicks         29 127
        Visiting_Team_Kicks     29 158
MIA     Home_Team_Kicks         32 141
        Visiting_Team_Kicks     26 145
MIN     Home_Team_Kicks         11 138
        Visiting_Team_Kicks     24 129
NE      Home_Team_Kicks         30 164
        Visiting_Team_Kicks     33 118
NO      Home_Team_Kicks         22 129
        Visiting_Team_Kicks     26 156
NYG     Home_Team_Kicks         27 138
        Visiting_Team_Kicks     32 133
NYJ     Home_Team_Kicks         26 138
        Visiting_Team_Kicks     24 122
OAK     Home_Team_Kicks         29 150
        Visiting_Team_Kicks     43 147
PHI     Home_Team_Kicks         25 176
        Visiting_Team_Kicks     26 124
PIT     Home_Team_Kicks         34 149
        Visiting_Team_Kicks     31 110
SD      Home_Team_Kicks         23 134
        Visiting_Team_Kicks     25 124
SEA     Home_Team_Kicks         19 145
        Visiting_Team_Kicks     36 140
SF      Home_Team_Kicks         25 156
        Visiting_Team_Kicks     26 133
STL     Home_Team_Kicks         22 142
        Visiting_Team_Kicks     28 142
TB      Home_Team_Kicks         30 136
        Visiting_Team_Kicks     28 120
TEN     Home_Team_Kicks         28 155
        Visiting_Team_Kicks     35 133
WAS     Home_Team_Kicks         39 124
        Visiting_Team_Kicks     31 130
Figure 3 Data: See Figure 1 data plus the comments
Graphs were made in R using Hadley Wickham’s ggplot2 package. Pointer to the data can be found at our previous post.
Filed in
Jobs
Subscribe to Decision Science News by Email (one email per week, easy unsubscribe)
Filed in
Ideas ,
R
Subscribe to Decision Science News by Email (one email per week, easy unsubscribe)
EVERY NFL FIELD GOAL SINCE 2002
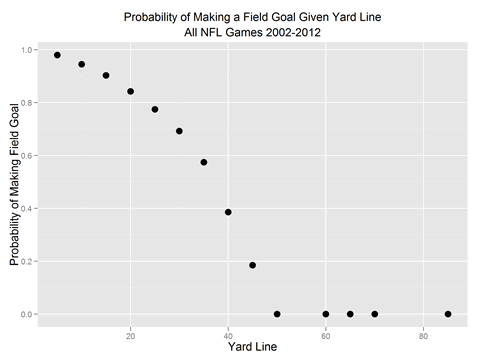
Click to enlarge
ADDENDUM: This Decision Science News post was covered by Bloomberg TV!
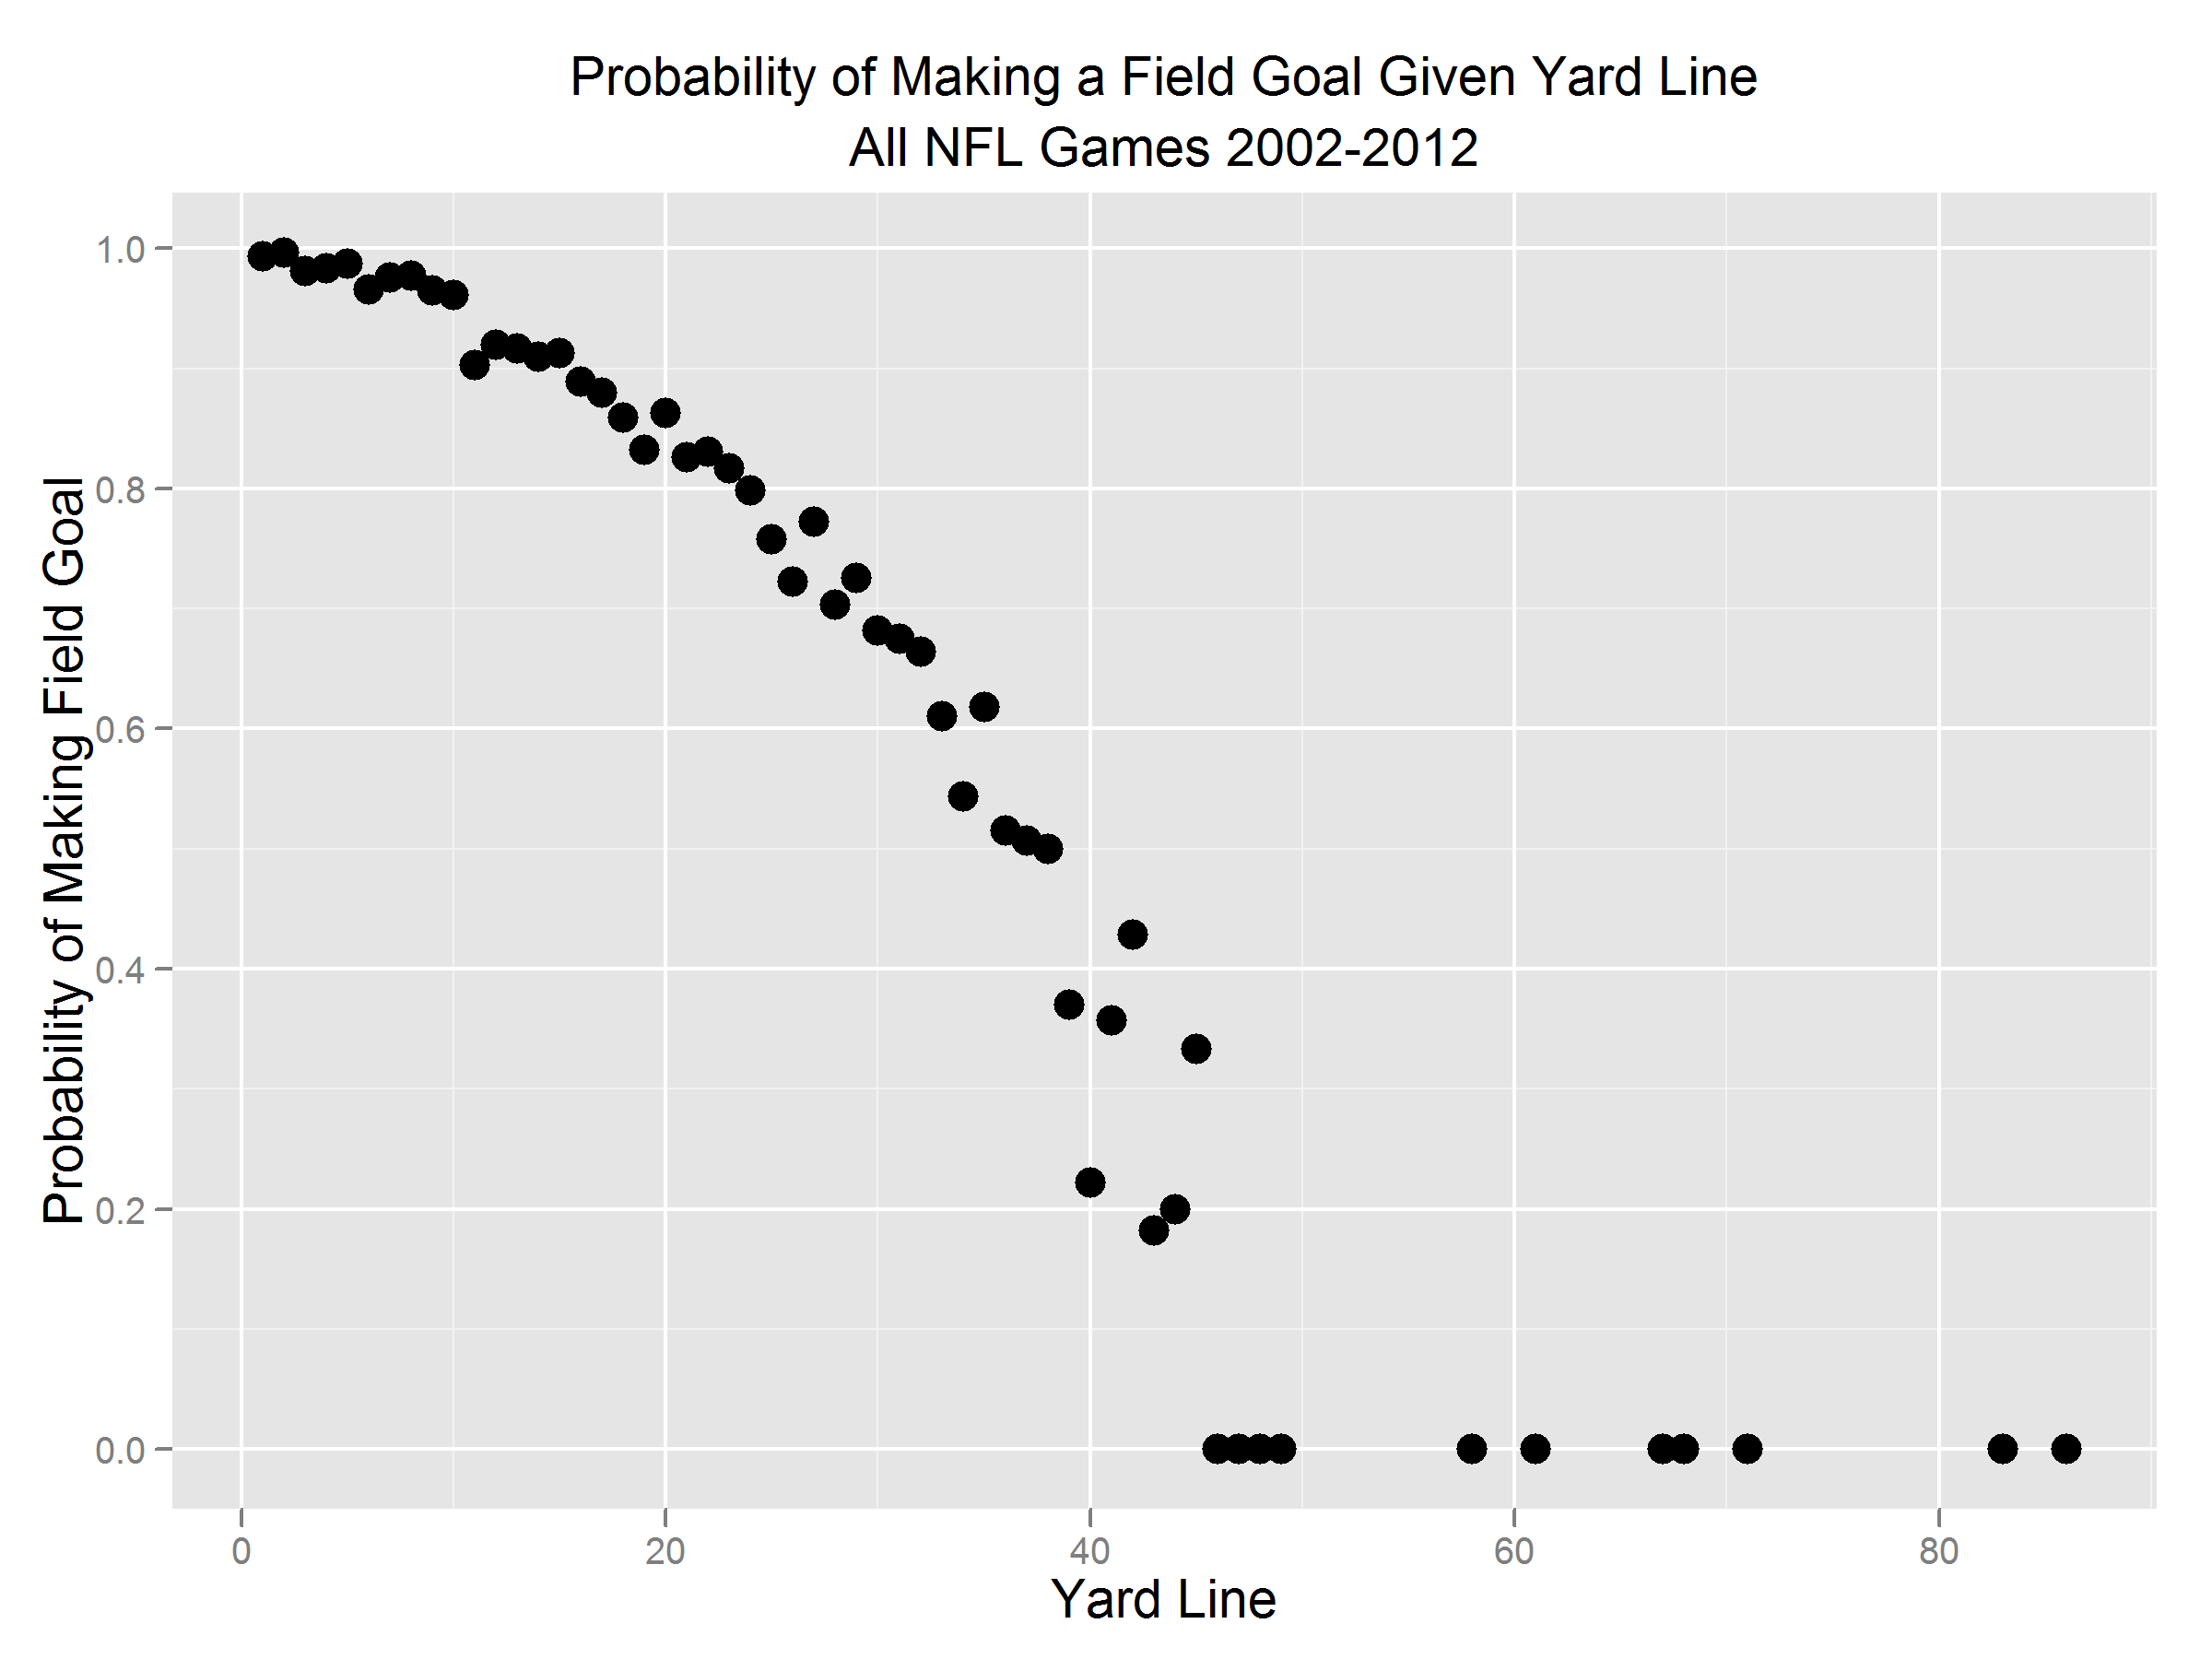
We looked at NFL punts before on Decision Science News. That’s old news. Field goals are the new hotness and Super Bowl Sunday is coming up, so let’s look at a kicker’s chances.
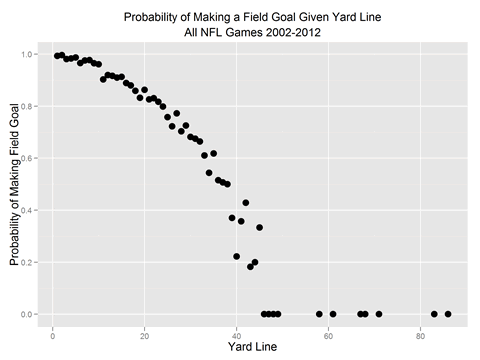
We’ve taken the same database and looked at the probability of getting the ball through the uprights depending on the yard line from which the kick starts. The result is above.
O data, you are so beautiful sometimes.
Those in need of a handy formula for the sidelines might want to use the following approximation. Let D be the yard line you are on:
- If D>50, you will miss
- Otherwise, your probability of making a field goal is about 1-.0004*D^2
We tried to fit a logit model, but it wasn’t pretty.
Speaking of beauty, one big data lesson is that data are more beautiful when binned. Here’s the more raw version:
Click to enlarge
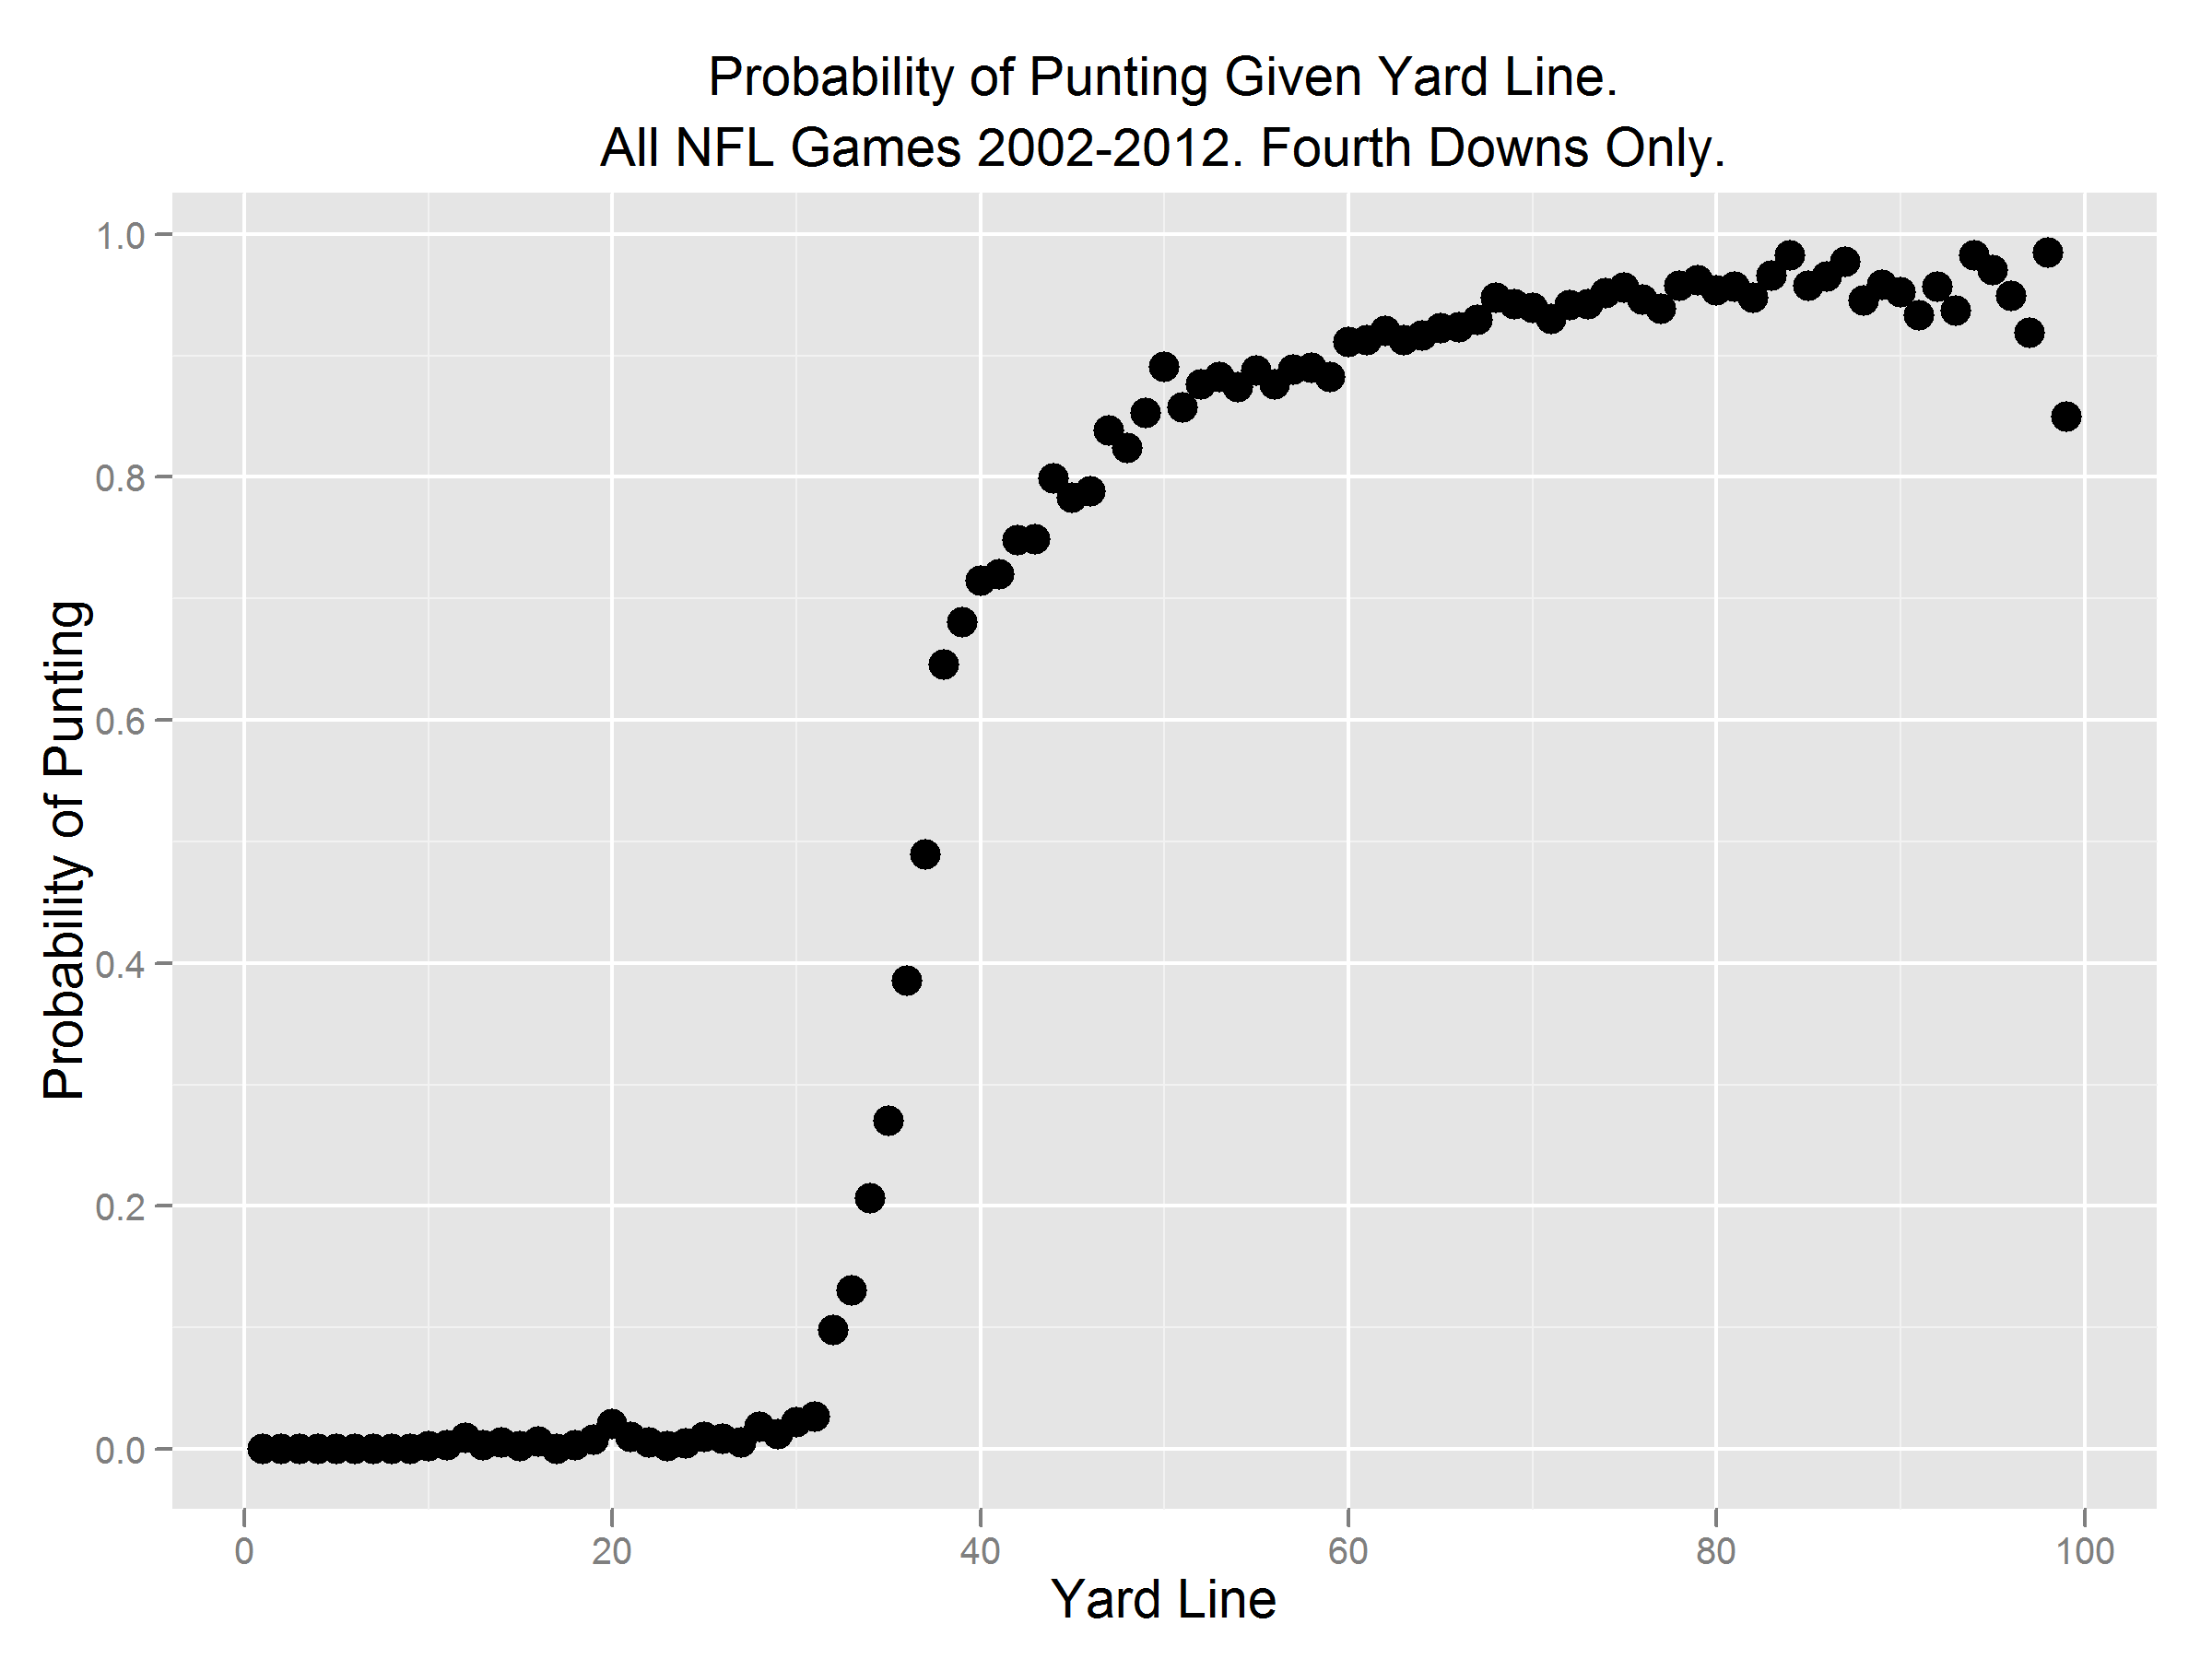
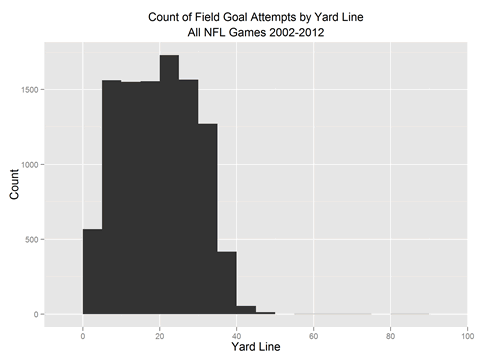
It seems coaches are aware of the maximum distance at which they have a prayer of making a field goal, and don’t even try otherwise:
Click to enlarge
Graphs were made in R using Hadley Wickham’s ggplot2 package. Pointer to the data can be found at our previous post.
ADDENDUM:
Reader Anders made a chart that looks at the count of good and bad field goals by distance (yard line + 17):

Click to enlarge
ADDENDUM
We changed the model we had originally posted for one with just 1 free parameter. Here’s the fit:
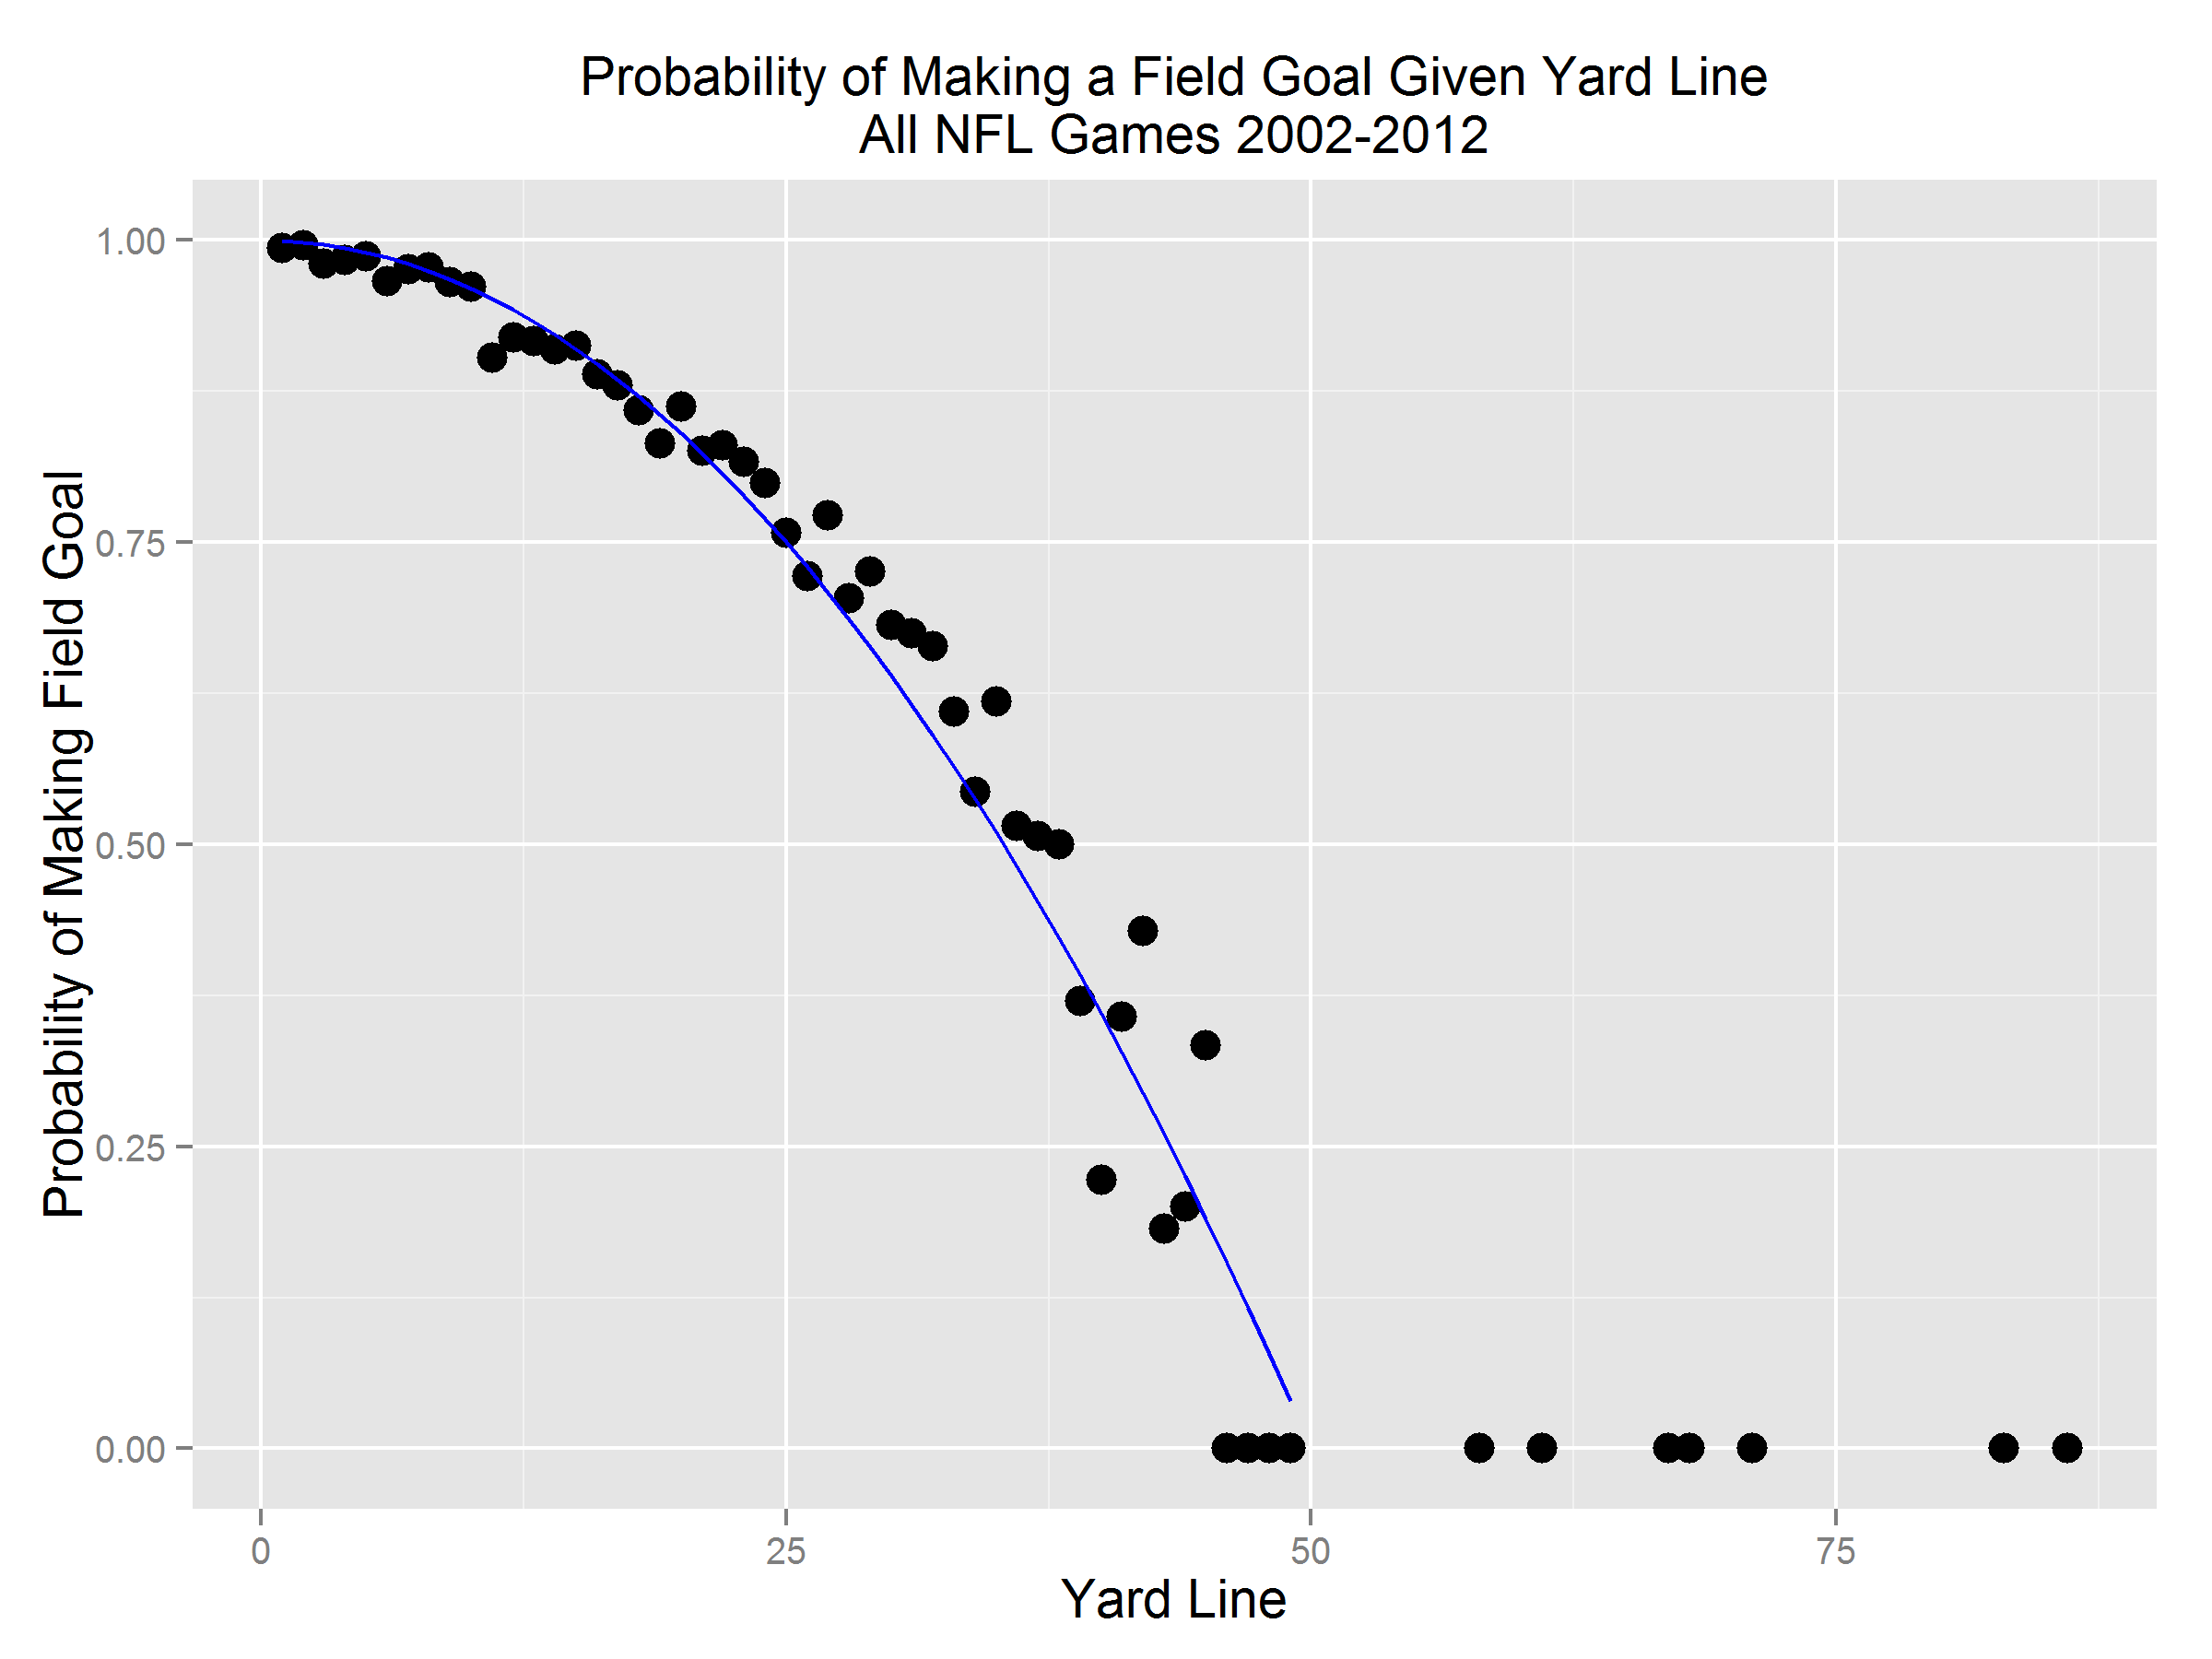
Click to enlarge
ADDENDUM
Some folks have asked if some of the longer attempts are noise. It appears so. Here are the descriptions of the attempts from behind the 50 yard line. On a regular attempt, the distance of the field goal is the yard line plus 17, so the case where the yard line is 86 and the field goal distance is suppose to be 68 yards, for example, seems to be a typo.
| ydline |
description |
| 58 |
(:01) S.Janikowski 76 yard field goal is No Good Center-J.Condo Holder-S.Lechler. A.Cromartie at SD 2 to SD 28 for 26 yards (T.Stewart). |
| 86 |
N.Rackers 68 yard field goal is No Good Holder-D.Johnson. R.Droughns at NYG 2 to NYG 31 for 29 yards (T.Castille). |
| 83 |
M.Crosby 69 yard field goal is No Good Short Holder-M.Flynn. |
| 86 |
R.Bironas 58 yard field goal is No Good Holder-C.Hentrich. P.Buchanon at HST -6 to HST 29 for 35 yards (R.Reynolds). Penalty on HST-C.Anderson Offensive Holding declined. |
| 67 |
(:05) W.Richey 51 yard field goal is No Good Center-J.Maese Holder-D.Zastudil. D.Townsend at PIT -5 to BLT 45 for 60 yards. Lateral to J.Farrior to BLT 35 for 10 yards (T.Heap). FUMBLES (T.Heap) RECOVERED by BLT-T.Jones at BLT 42. T.Jones to BLT 42 for no gain (J.Gildon). |
| 61 |
(:01) J.Elam 57 yard field goal is No Good Center-M.Lepsis Holder-T.Rouen. C.McAlister at BLT -7 for 107 yards TOUCHDOWN. |
| 71 |
(1:46) T.Peterson 48 yard field goal is No Good Center-D.O’Leary Holder-T.Maddox. I.Bashir at IND -9 to IND 37 for 46 yards (R.Bailey). |
| 68 |
(:01) J.Hanson 50 yard field goal is No Good Center-B.Banta Holder-J.Jett. D.Sharper at GB -9 to GB 35 for 44 yards (R.Brown). |
Filed in
Conferences
Subscribe to Decision Science News by Email (one email per week, easy unsubscribe)
24TH SUBJECTIVE PROBABILITY, UTILITY, AND DECISION-MAKING CONFERENCE

The European Association for Decision Making invites you to attend its next biannual
24th Subjective Probability, Utility, and Decision Making Conference (SPUDM
24), which will be held at IESE Business School – University of Navarra in Barcelona,
Spain, on August 18-22, 2013.
Submissions of paper abstracts, poster abstracts, and proposals for workshops are
invited on any topic in basic and applied judgment and decision making research.
Deadline for all submissions is March 8, 2013.
The organizing committee is pleased to announce that the conference will feature the
following invited speakers:
• Timothy D. Wilson, University of Virginia, USA
• Colin F. Camerer, California Institute of Technology, USA
• Robin Hogarth, Universitat Pompeu Fabra, Spain
• Ralph Hertwig, Max Planck Institute for Human Development, Germany
The call for papers is available at:
http://www.iese.edu/en/events/OtrosEventos/SPUDM24/Home/Home.asp
Attending this meeting will also be an opportunity to discover Barcelona, one of the
most unique and architecturally distinctive cities of the world. Barcelona is the capital
of Spain’s Catalan region, which has produced a number of the world’s most prominent
artists including Pablo Picasso and Salvador Dalí. The architect Antoni Gaudí also left
his indelible mark on the city through a number of remarkable buildings such as La
Sagrada Familia, La Pedrera, and La Casa Batlló.
We look forward to seeing and welcoming you in Barcelona!
The local organizing committee:
Elena Reustkaja (IESE, Spain)
Mario Capizzani (IESE, Spain)
Franz Heukamp (IESE, Spain)
Robin Hogarth (UPF, Spain)
NEW DECISION JOURNAL FOCUSES ON THEORETICAL ISSUES

Good news for Judgment and Decision Making researchers: a new APA journal entitled Decision is getting ready to launch. Be on the lookout for its web site in the next weeks. Here are some details.
Decision
A journal for research on judgment and decision making
Decision is a multidisciplinary research journal focused on a theoretical understanding of neural, cognitive, social, and economic aspects of judgment and decision-making behavior. Decision will publish articles on all areas related to judgment and decision- making research including probabilistic inference, prediction, evaluation, choice, decisions under risk or uncertainty, and economic games. The journal will publish articles that present new theory or new empirical research addressing theoretical issues or both. To achieve this goal, Decision will publish three types of articles: long articles that make major theoretical contributions, shorter articles that make major empirical contributions attacking important theoretical issues, and brief review articles that target rapidly rising theoretical trends or new theoretical topics in decision making.
Editorial Board
Colin Camerer
Nick Chater
Peter Dayan
Gerd Gigerenzer
Reid Hastie
Mark Machina
Amnon Rapoport
Roger Ratcliff
Valerie Reyna
Jim Sherman
Richard Shiffrin
Josh Tenenbaum
Joyce Wang
Thomas Wallsten
Angela Yu
Filed in
Ideas ,
R
Subscribe to Decision Science News by Email (one email per week, easy unsubscribe)
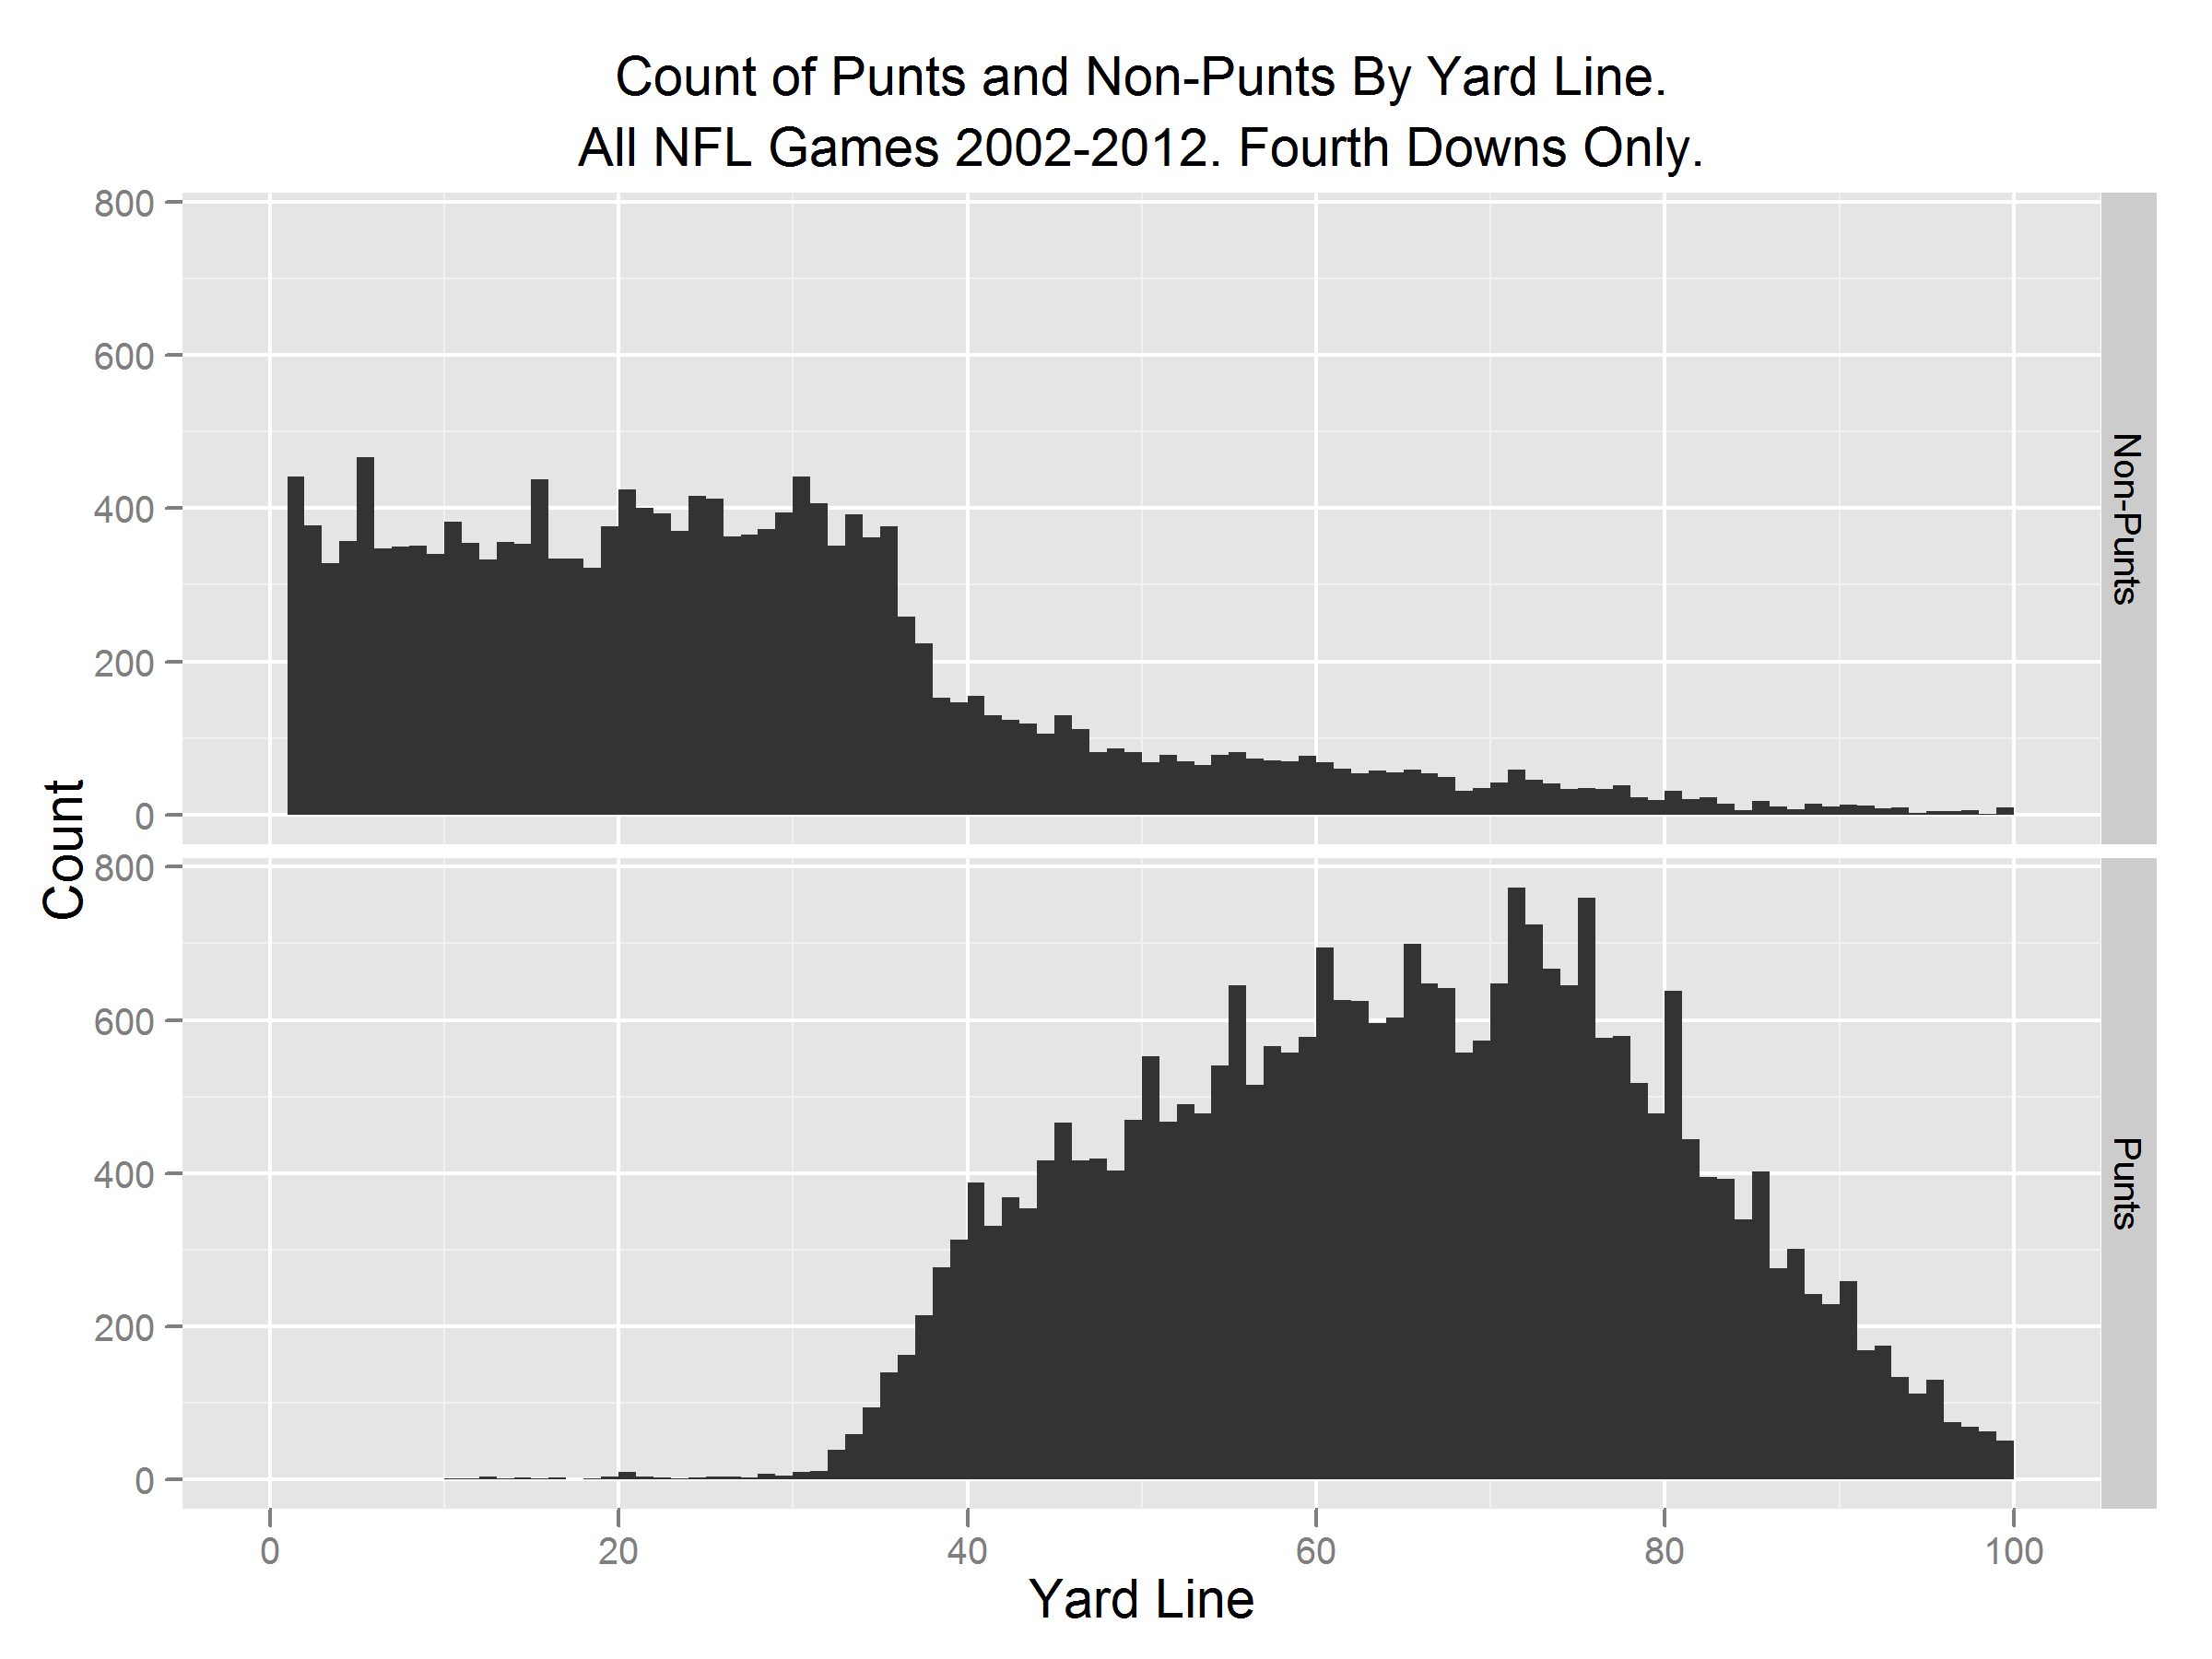
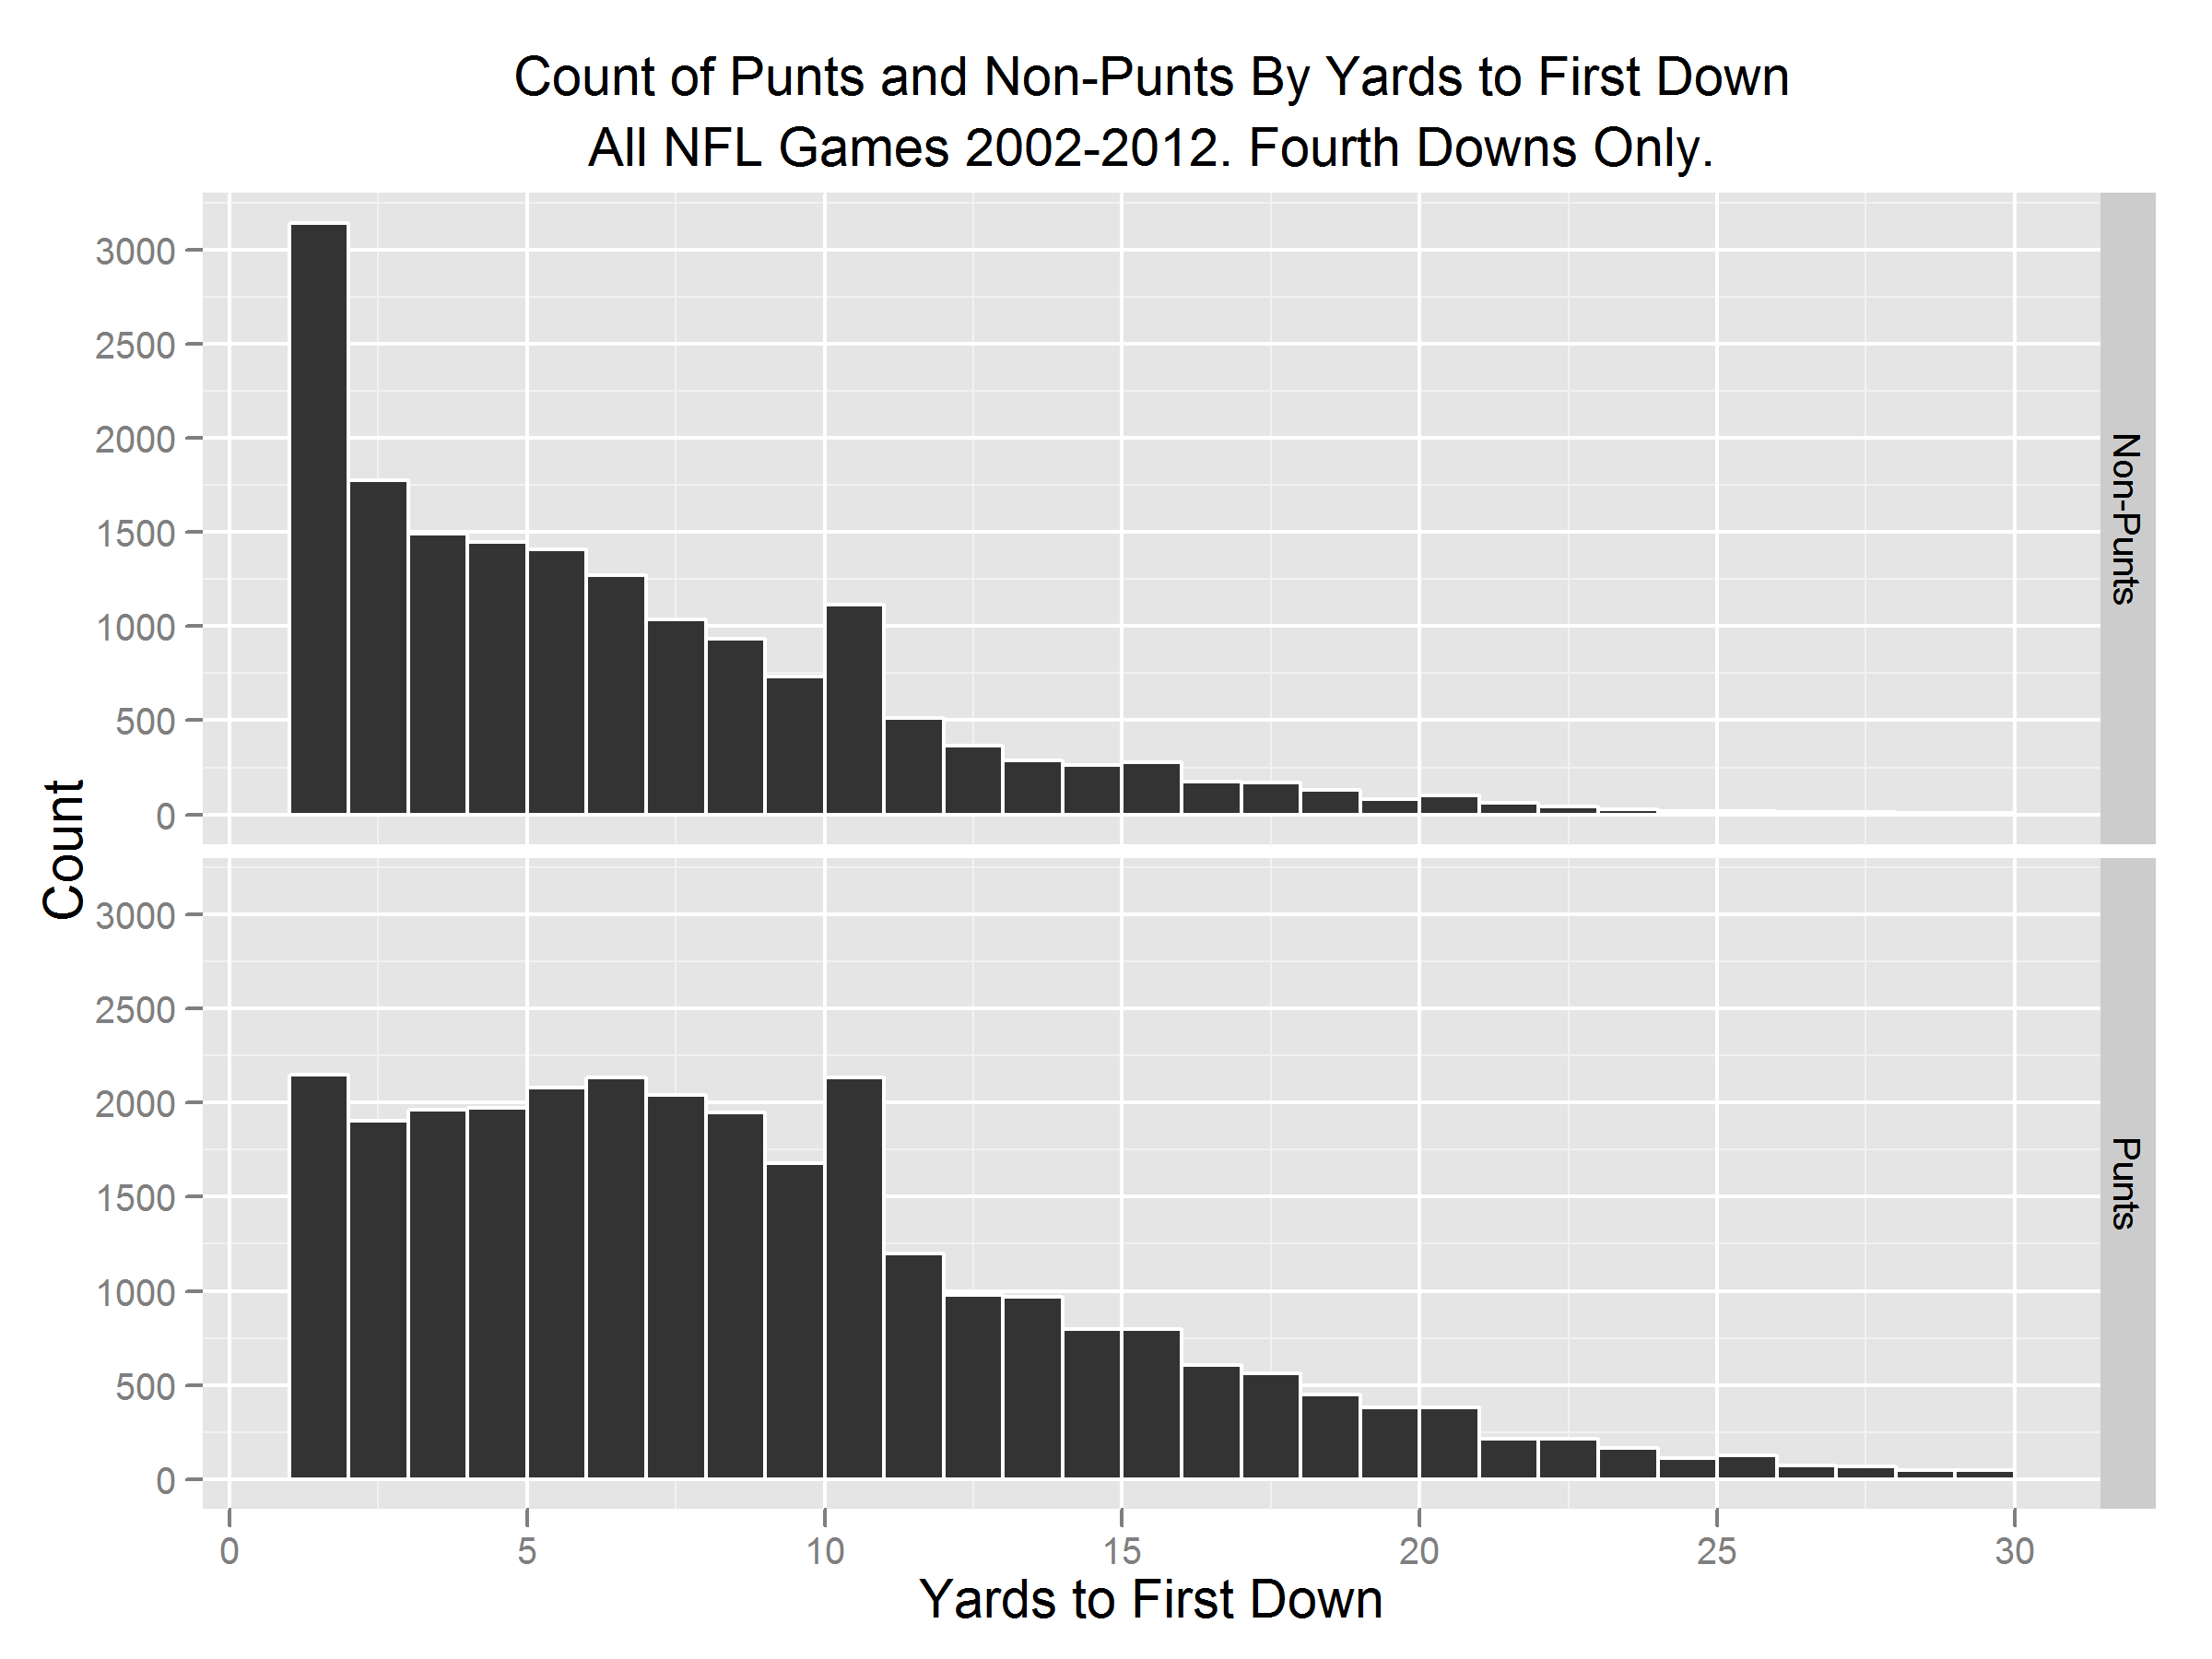
ANALYSIS OF THE PUNTING DECISION BASED ON 11 YEARS OF PLAY-BY-PLAY DATA

CLICK TO ENLARGE
The site reddit told us about data on every single NFL (U.S. National Football League) play since 2002. We read it in and did an analysis of punting. The results are beautiful.
North Americans metaphorically say they’re “going to punt” and people not familiar with American and Canadian Football can be unclear about what they mean. In the UK, “punt” means many things (such as pushing a boat with a stick or visiting a prostitute), but not the North American metaphorical sense.
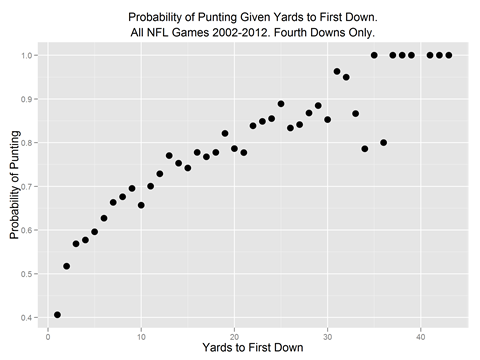
Loosely put, to punt means to play it safe by not trying something risky that could leave you worse off. In football, it’s kicking the ball into a better field position instead of staying where you are and fighting because if you stay and fight you might lose and your opponent will have you in a bad field position. You punt when your back is to the wall, on your last “down” or opportunity to do something before the opponent automatically gets the ball. Higher risk alternatives to punting are passing or running with the ball. When close to the opponent’s goal, an alternative is trying to kick a field goal. [I realize that’s a bad description but maybe we can crowdsource a better one].
We made some graphs of the punting decision and found some beauty in these strategic behavior data.
CLICK TO ENLARGE

CLICK TO ENLARGE

CLICK TO ENLARGE
Thanks to the reddit post and Advanced NFL Stats, as well as to the open source R language and Hadley Wickham‘s ggplot2.